
Heatmap
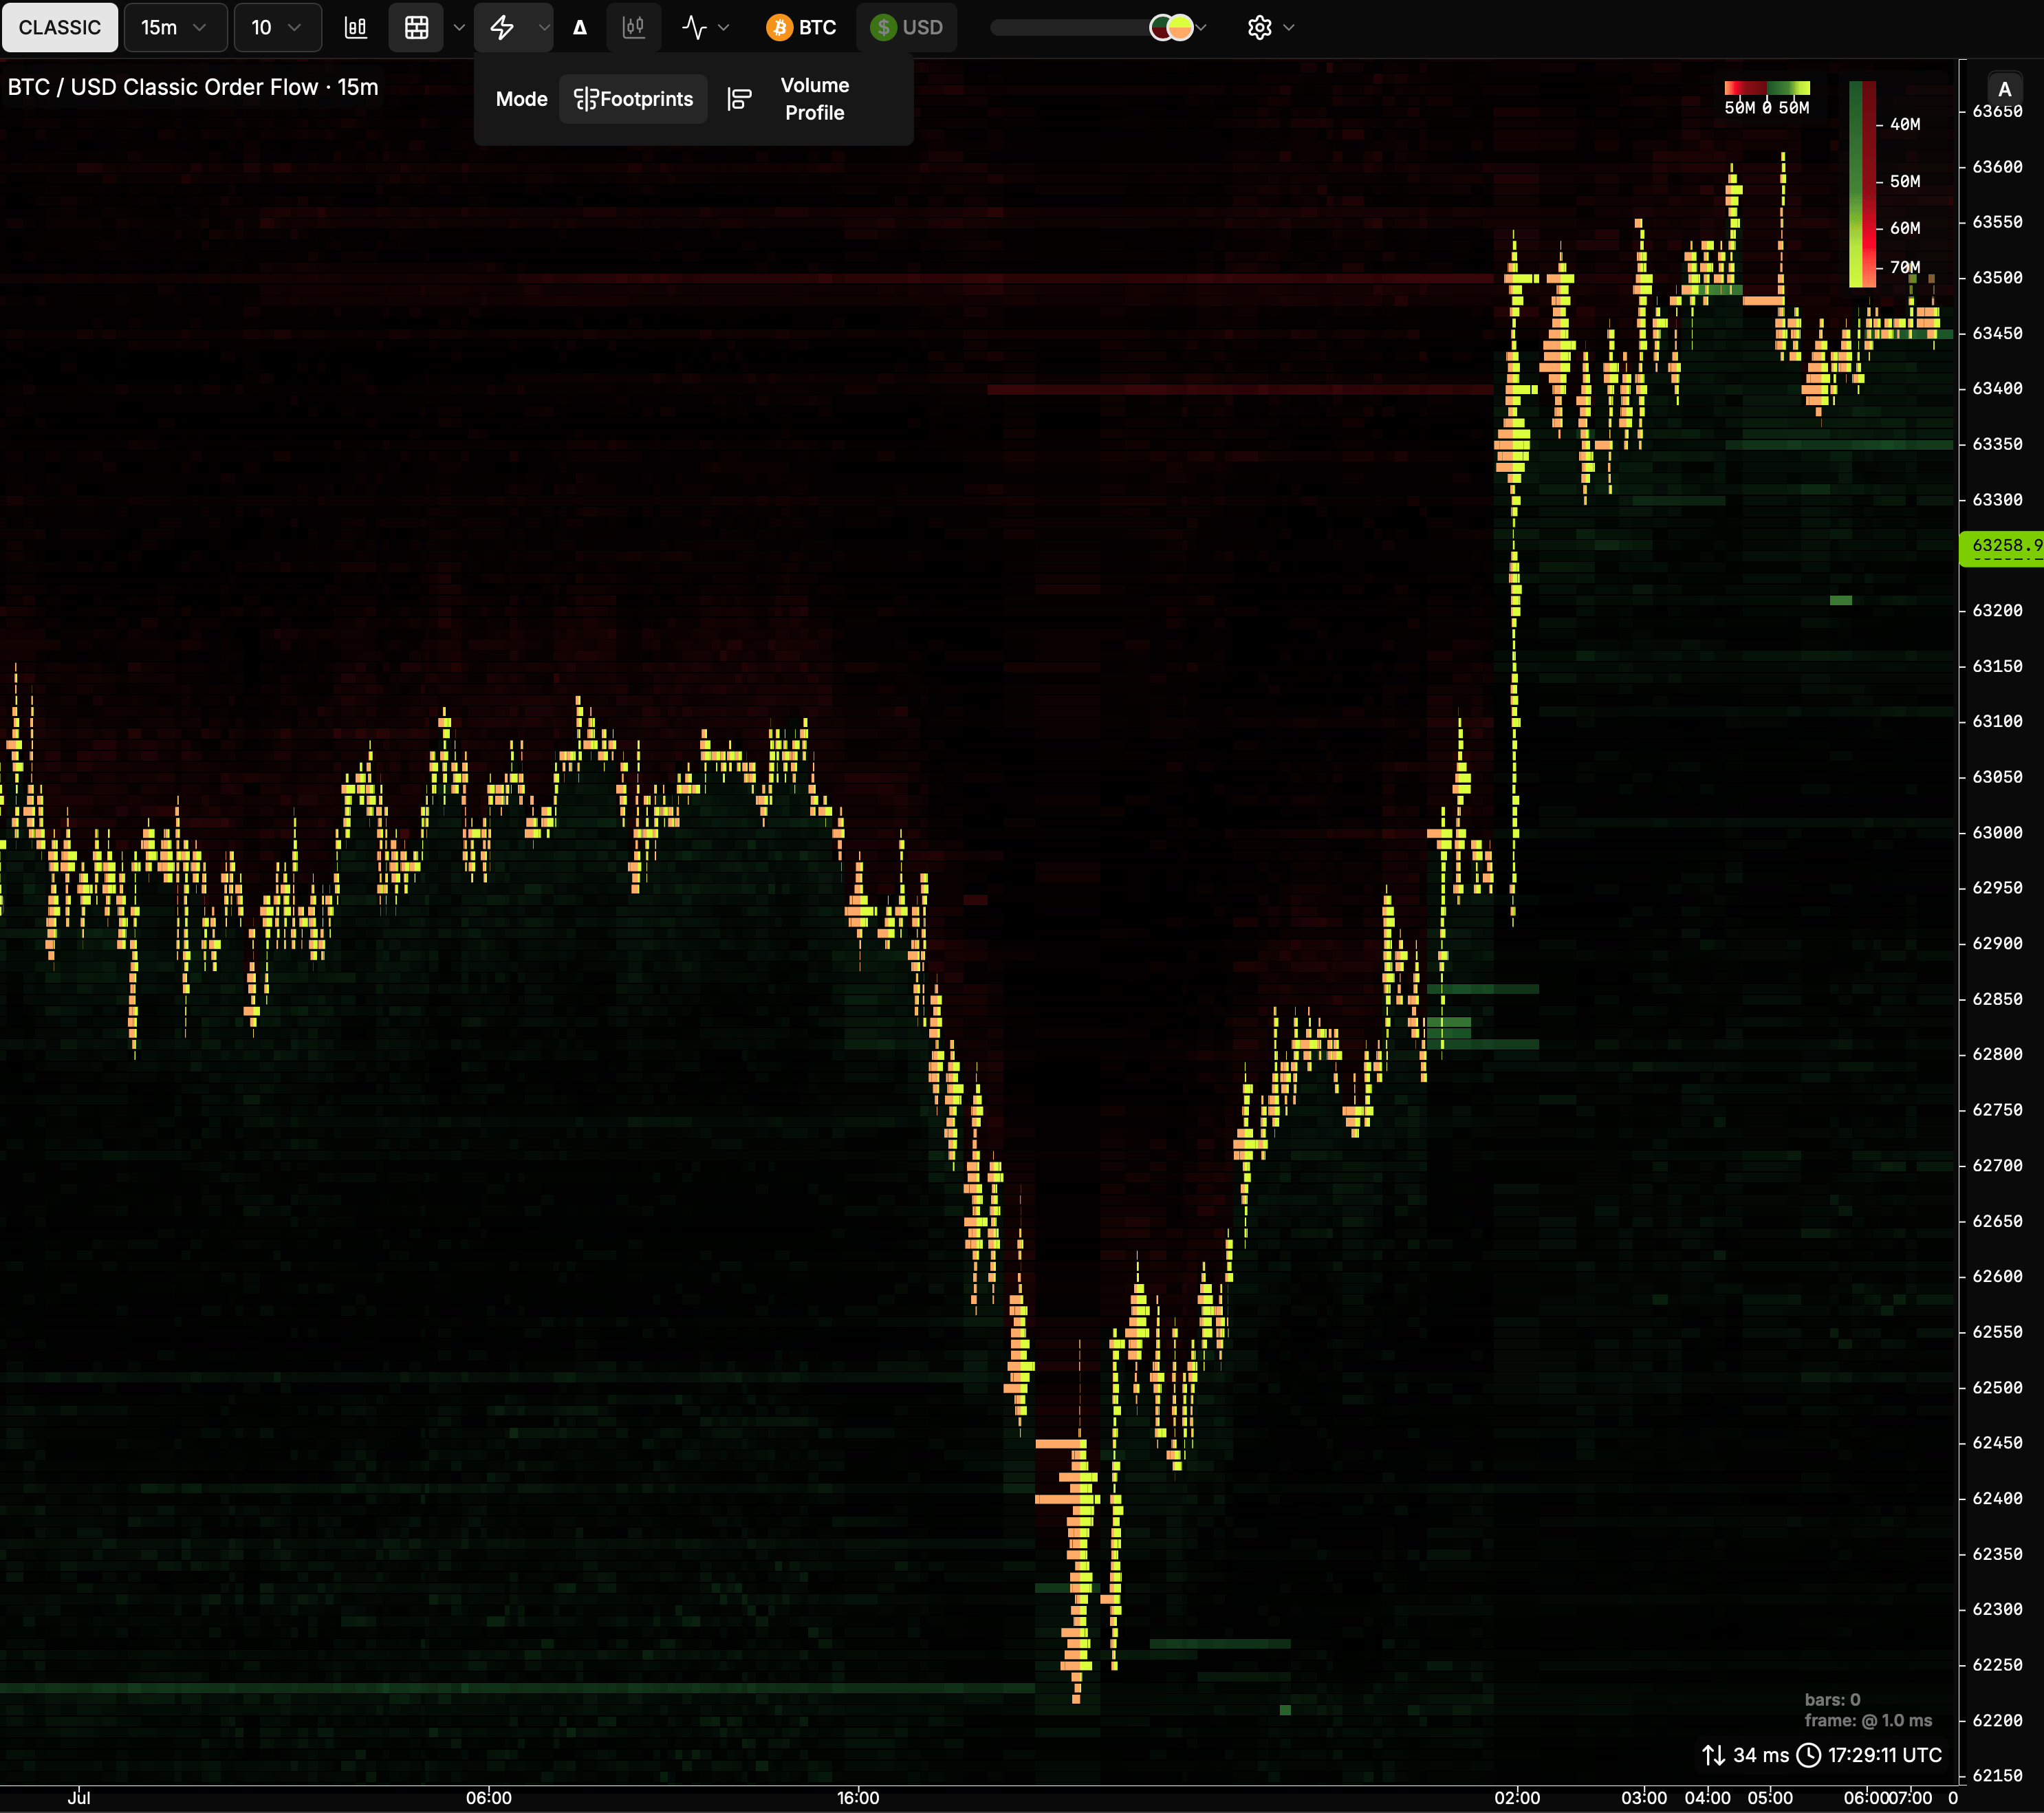
Order book heatmaps were popularized by Bookmap around 2014–2016 and remain the standard way to see resting limit orders evolve through time: each column is a snapshot of the book, and color intensity marks larger size.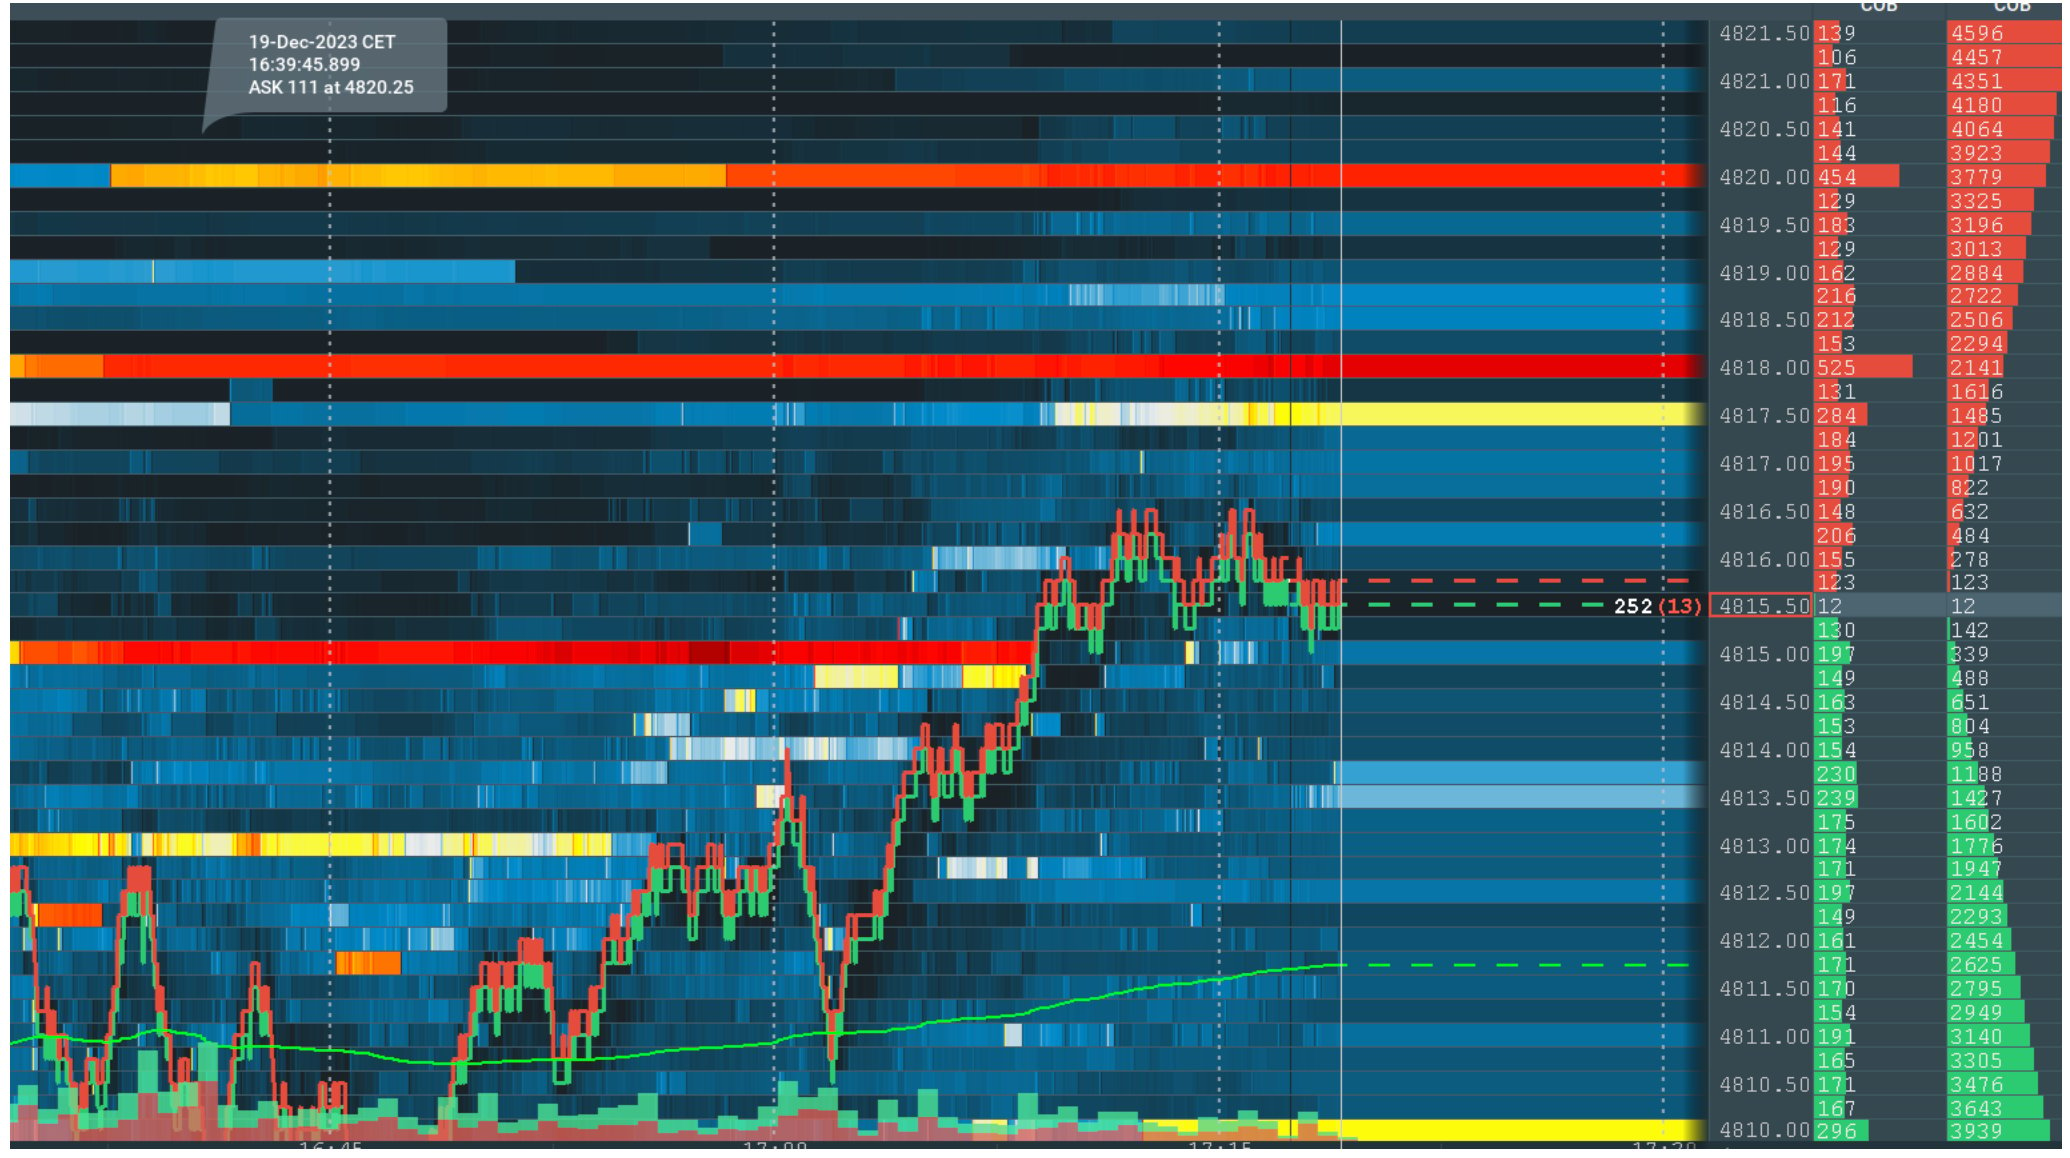
Bookmap
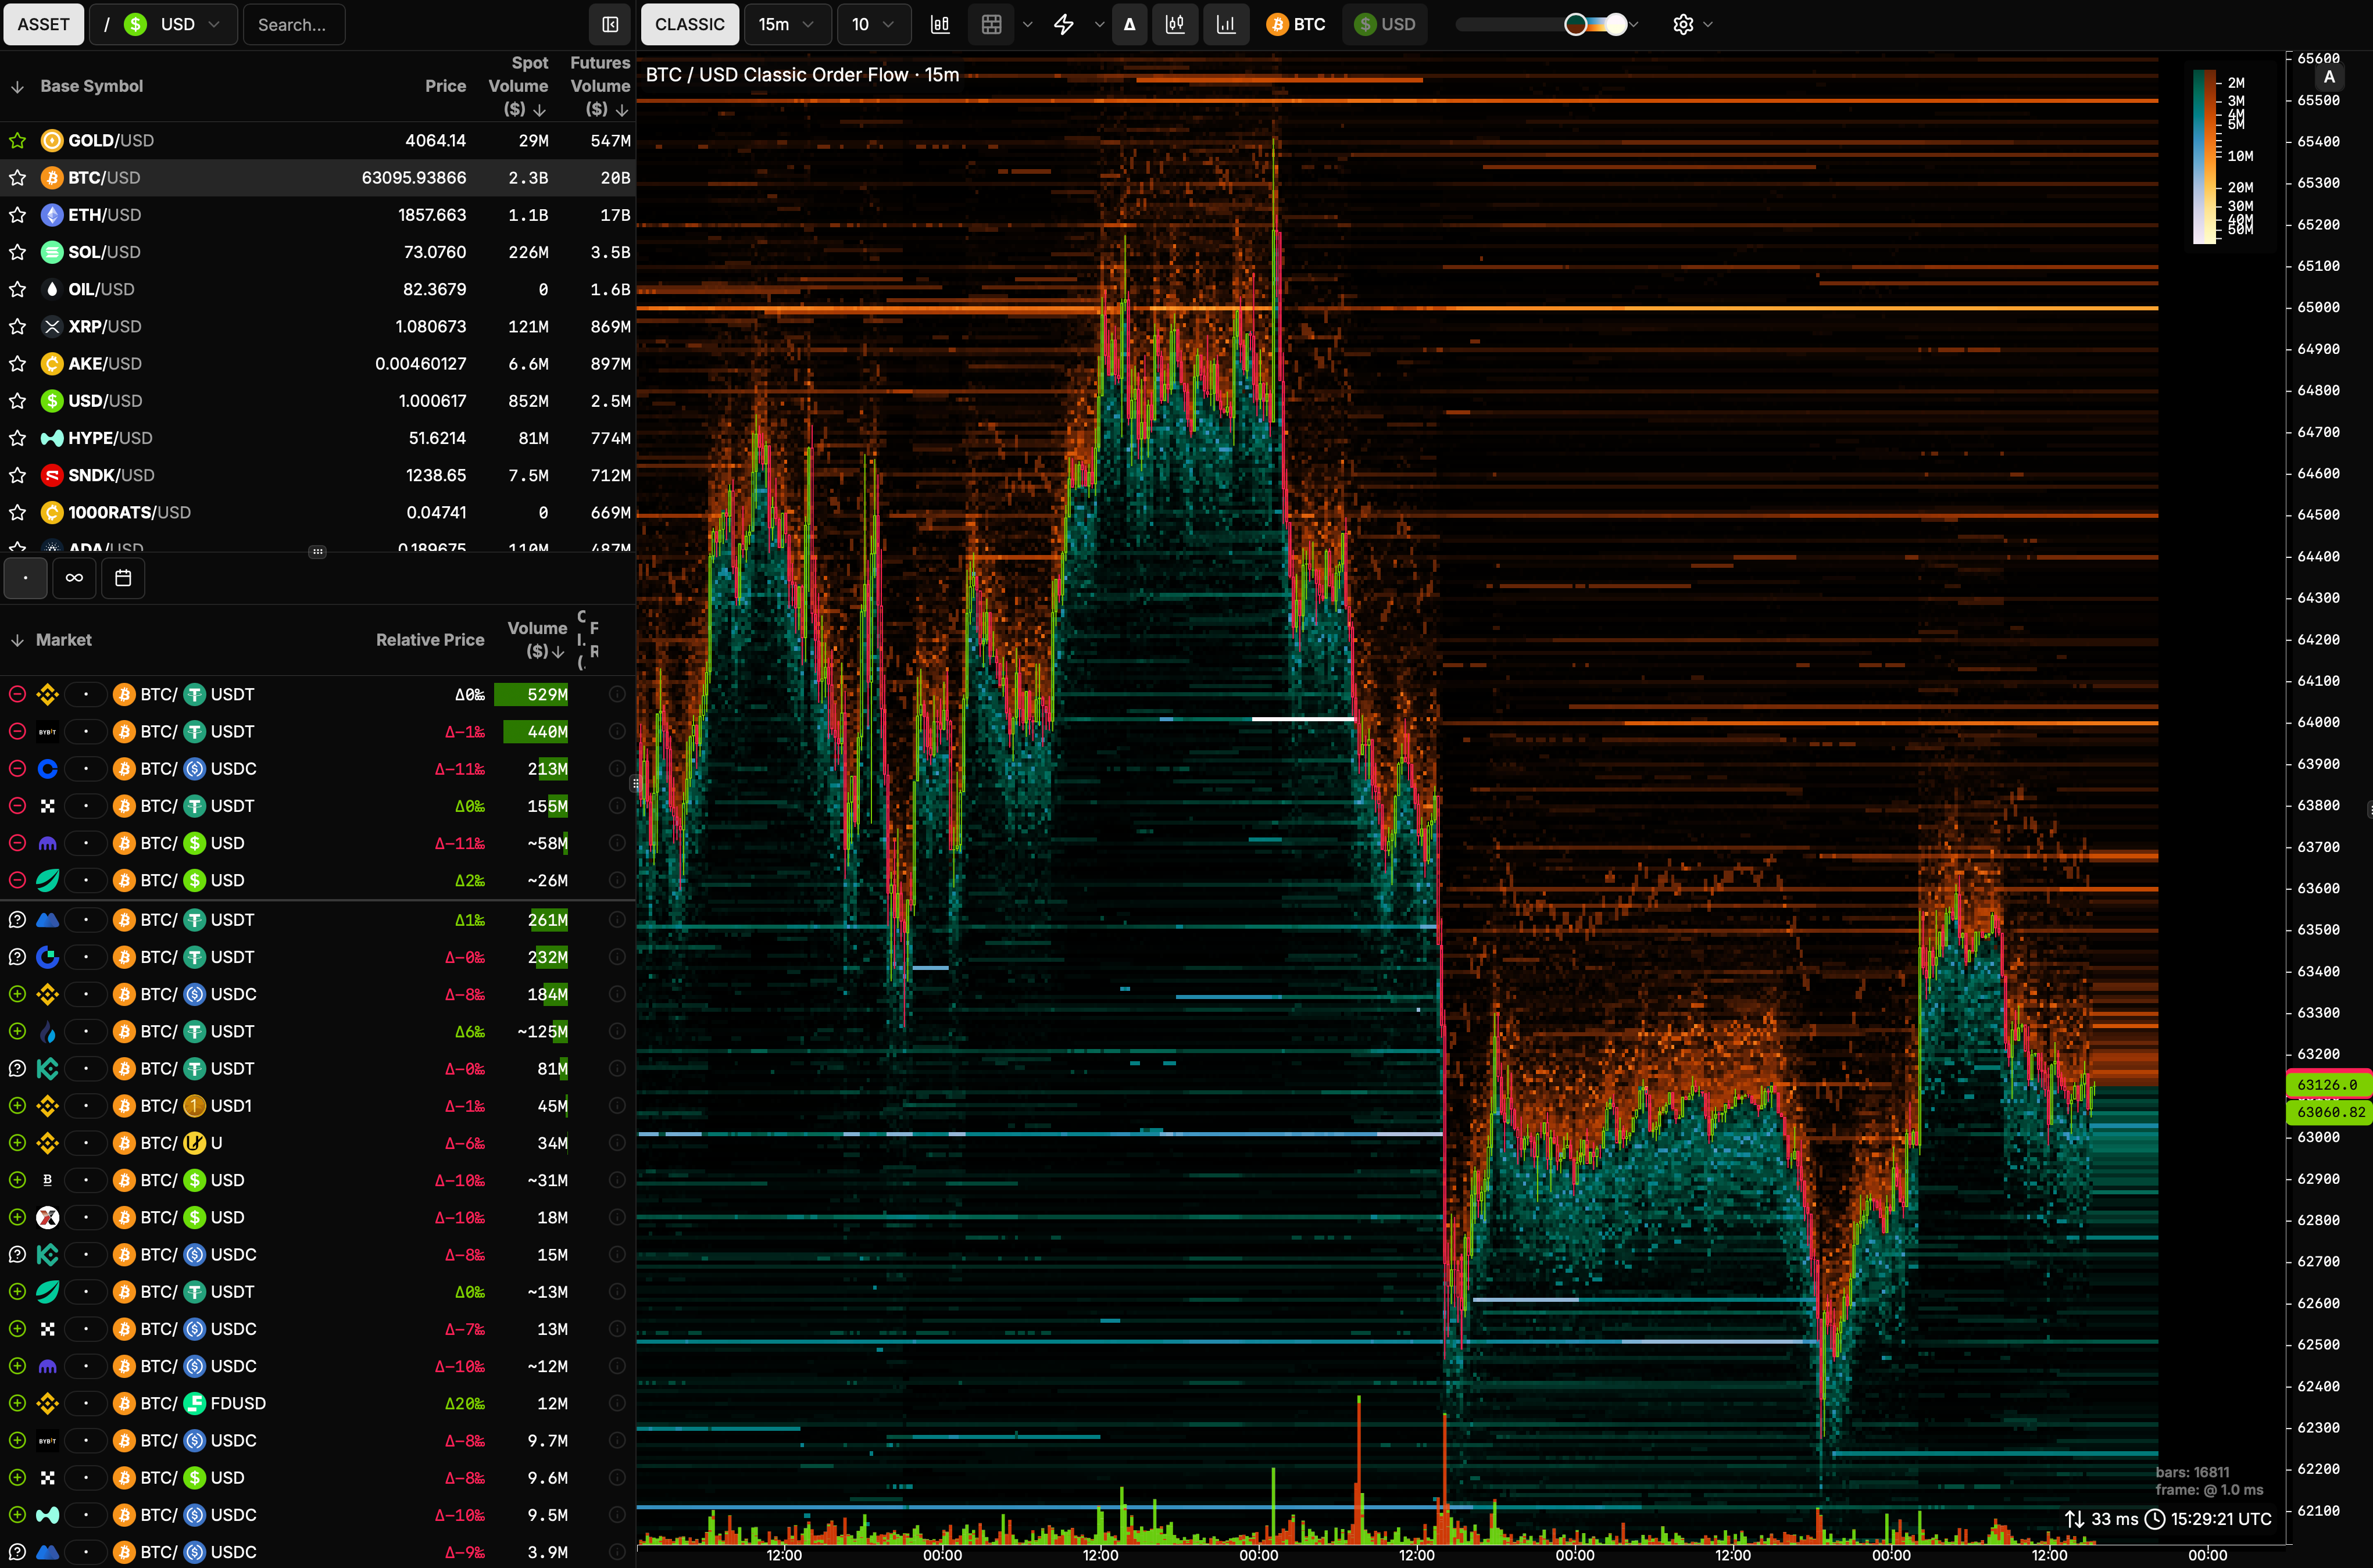
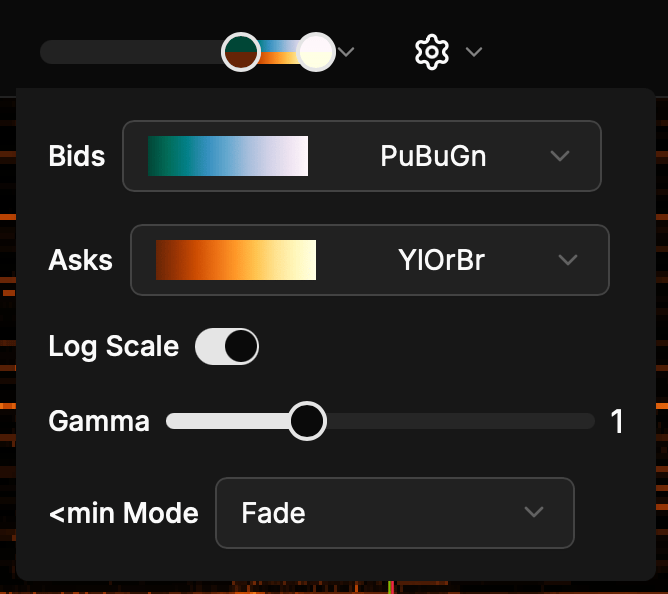
Price grouping
Book data is first bucketed by a chosen price step into non-overlapping groups. Bids and asks use opposite edges so the spread stays clean:- Bids group down (toward lower prices)
- Asks group up (toward higher prices)


Multi-exchange aggregation
After each venue is grouped the same way, the heatmap always aggregates across the selected exchanges. There is no per-venue layer in the heatmap: one cell, one value for the whole selection. Sizes are signed: bids positive, asks negative. Cells are summed with that sign:- Same side across venues adds (two bids in one cell → larger positive total)
- Mixed sides net out (bid on one venue, ask on another in the same cell → a bid/ask delta, not two stacks drawn on top of each other)

Trades profile
Volume profile (total volume by price, without splitting buy and sell) was already common for years. MarketDelta’s Footprint® charts (around 2003) popularized the next step: the same price ladder inside each bar, with aggressive buys and sells shown separately. Other platforms use other names for that idea. On MarketLens it is trades profile.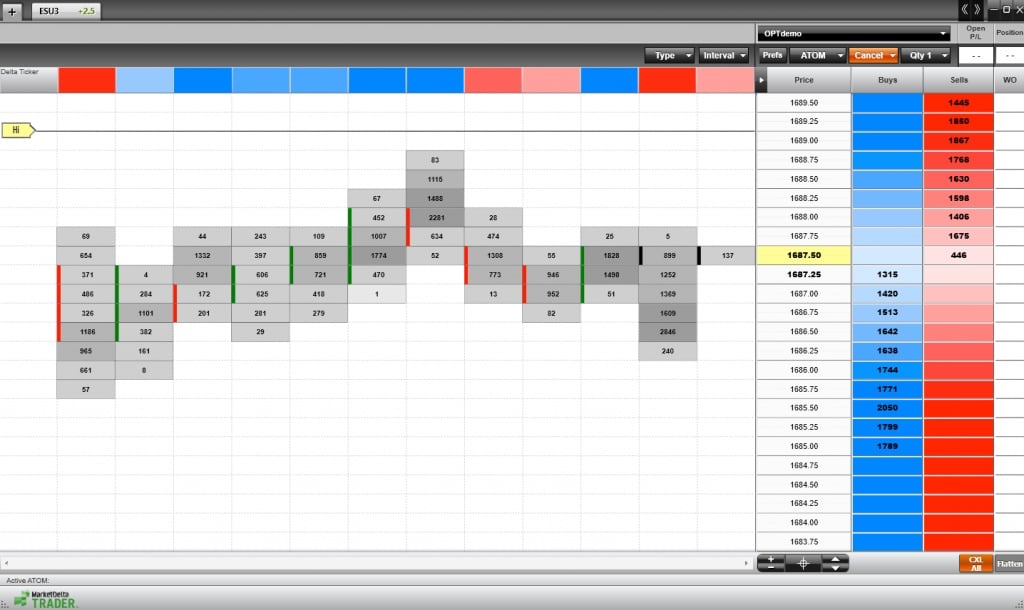
MarketDelta's Footprint charts
A core UI goal is to read size without staring at digits. Each price level is a horizontal bar whose length is proportional to size on a shared scale across the profile.
Display modes
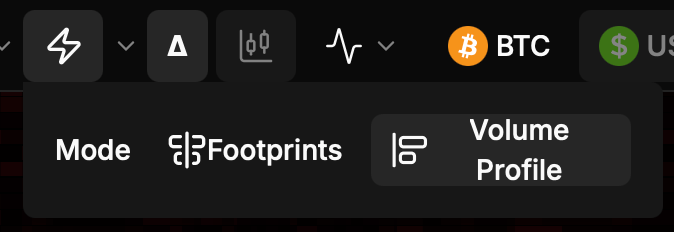
A volume profile is total size at each level (buys + sells), often drawn as bars from one side. Delta is buys − sells per level.

Price grouping
Auction analysis inside candles needs stable buckets. Unlike the heatmap’s bid-down / ask-up edges, trades profile levels are always grouped down into half-open intervals so every trade lands in exactly one bucket (left edge inclusive, right edge exclusive). Example with a $10 step: a print at 1239.9 goes to the 1230 bucket; a print at 1240.0 goes to 1240.
Multi-exchange aggregation
Trades profiles work on executed volume only (no signed bid/ask book cancellation). You can either:- Aggregate — sum size at each level (and each side, when buys and sells are separate) across the selected exchanges, or
- Show per exchange — draw venues as separate bars/segments at the same levels.
References in product
- Unified order flow — limits and markets in one visual space
- L2 order book — live multi-market depth
- Tape — aggressive prints as a visual stream