
Volume and volume delta
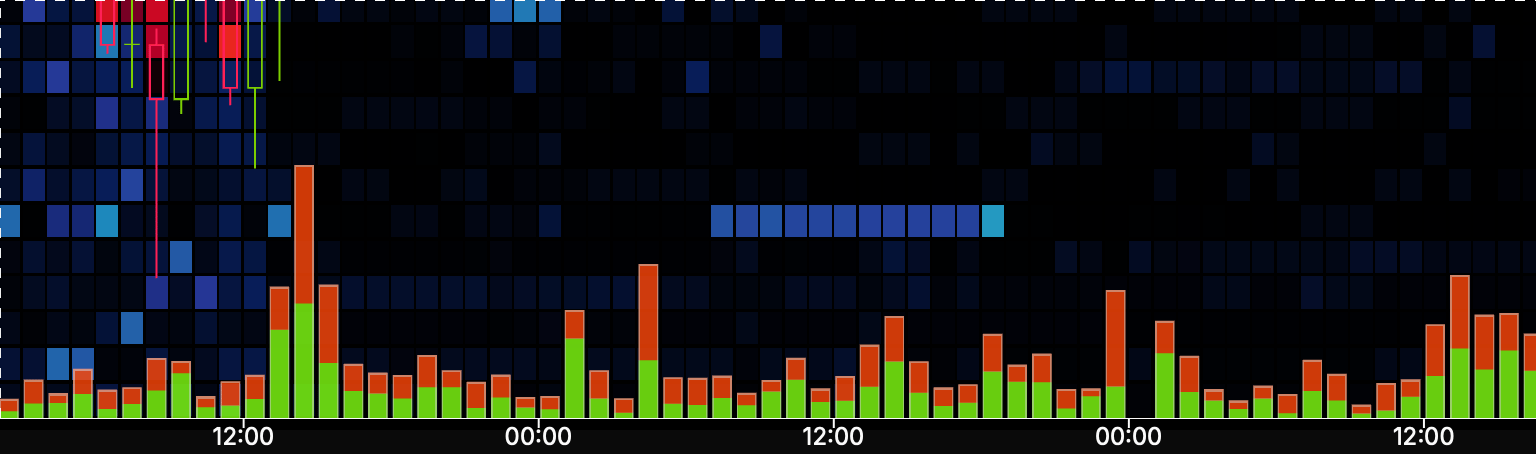
Volume is total executed size over a bar or window. MarketLens builds it from the raw trade stream; the useful work is normalizing units for multi-market views. Venues may report size in contracts, base, or quote. MarketLens normalizes those prints into base or quote (contracts are translated into the same unit system). Spot, linear, and inverse futures can share one multi-market view. You can switch base ↔ quote in the UI; series follow that choice. Volume delta is buy volume minus sell volume in those same units: Buy / sell here follow the venue’s aggressor (taker) side on each print: which side crossed the book. Both series are summed into the current timeframe after unit normalization. Volume and volume delta are usually drawn as a histogram under the chart (one column per time step):- Volume — stacked bars: green buy volume, red sell volume; together they are total volume (activity intensity).
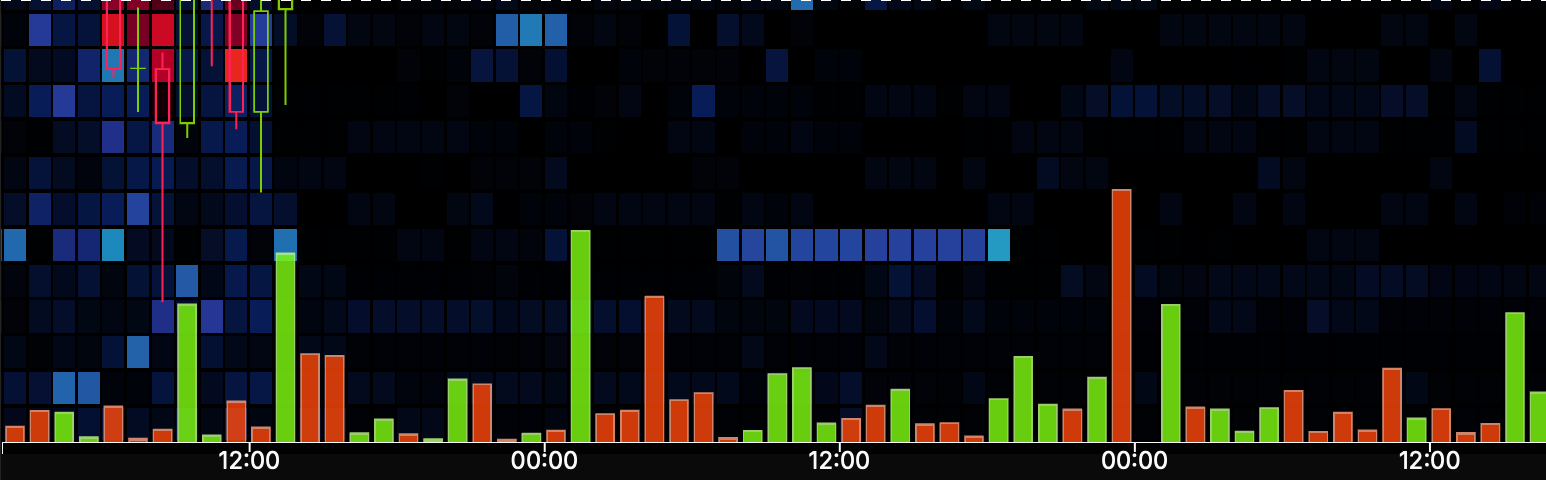
- Volume delta — signed bars: green when net buy, red when net sell.
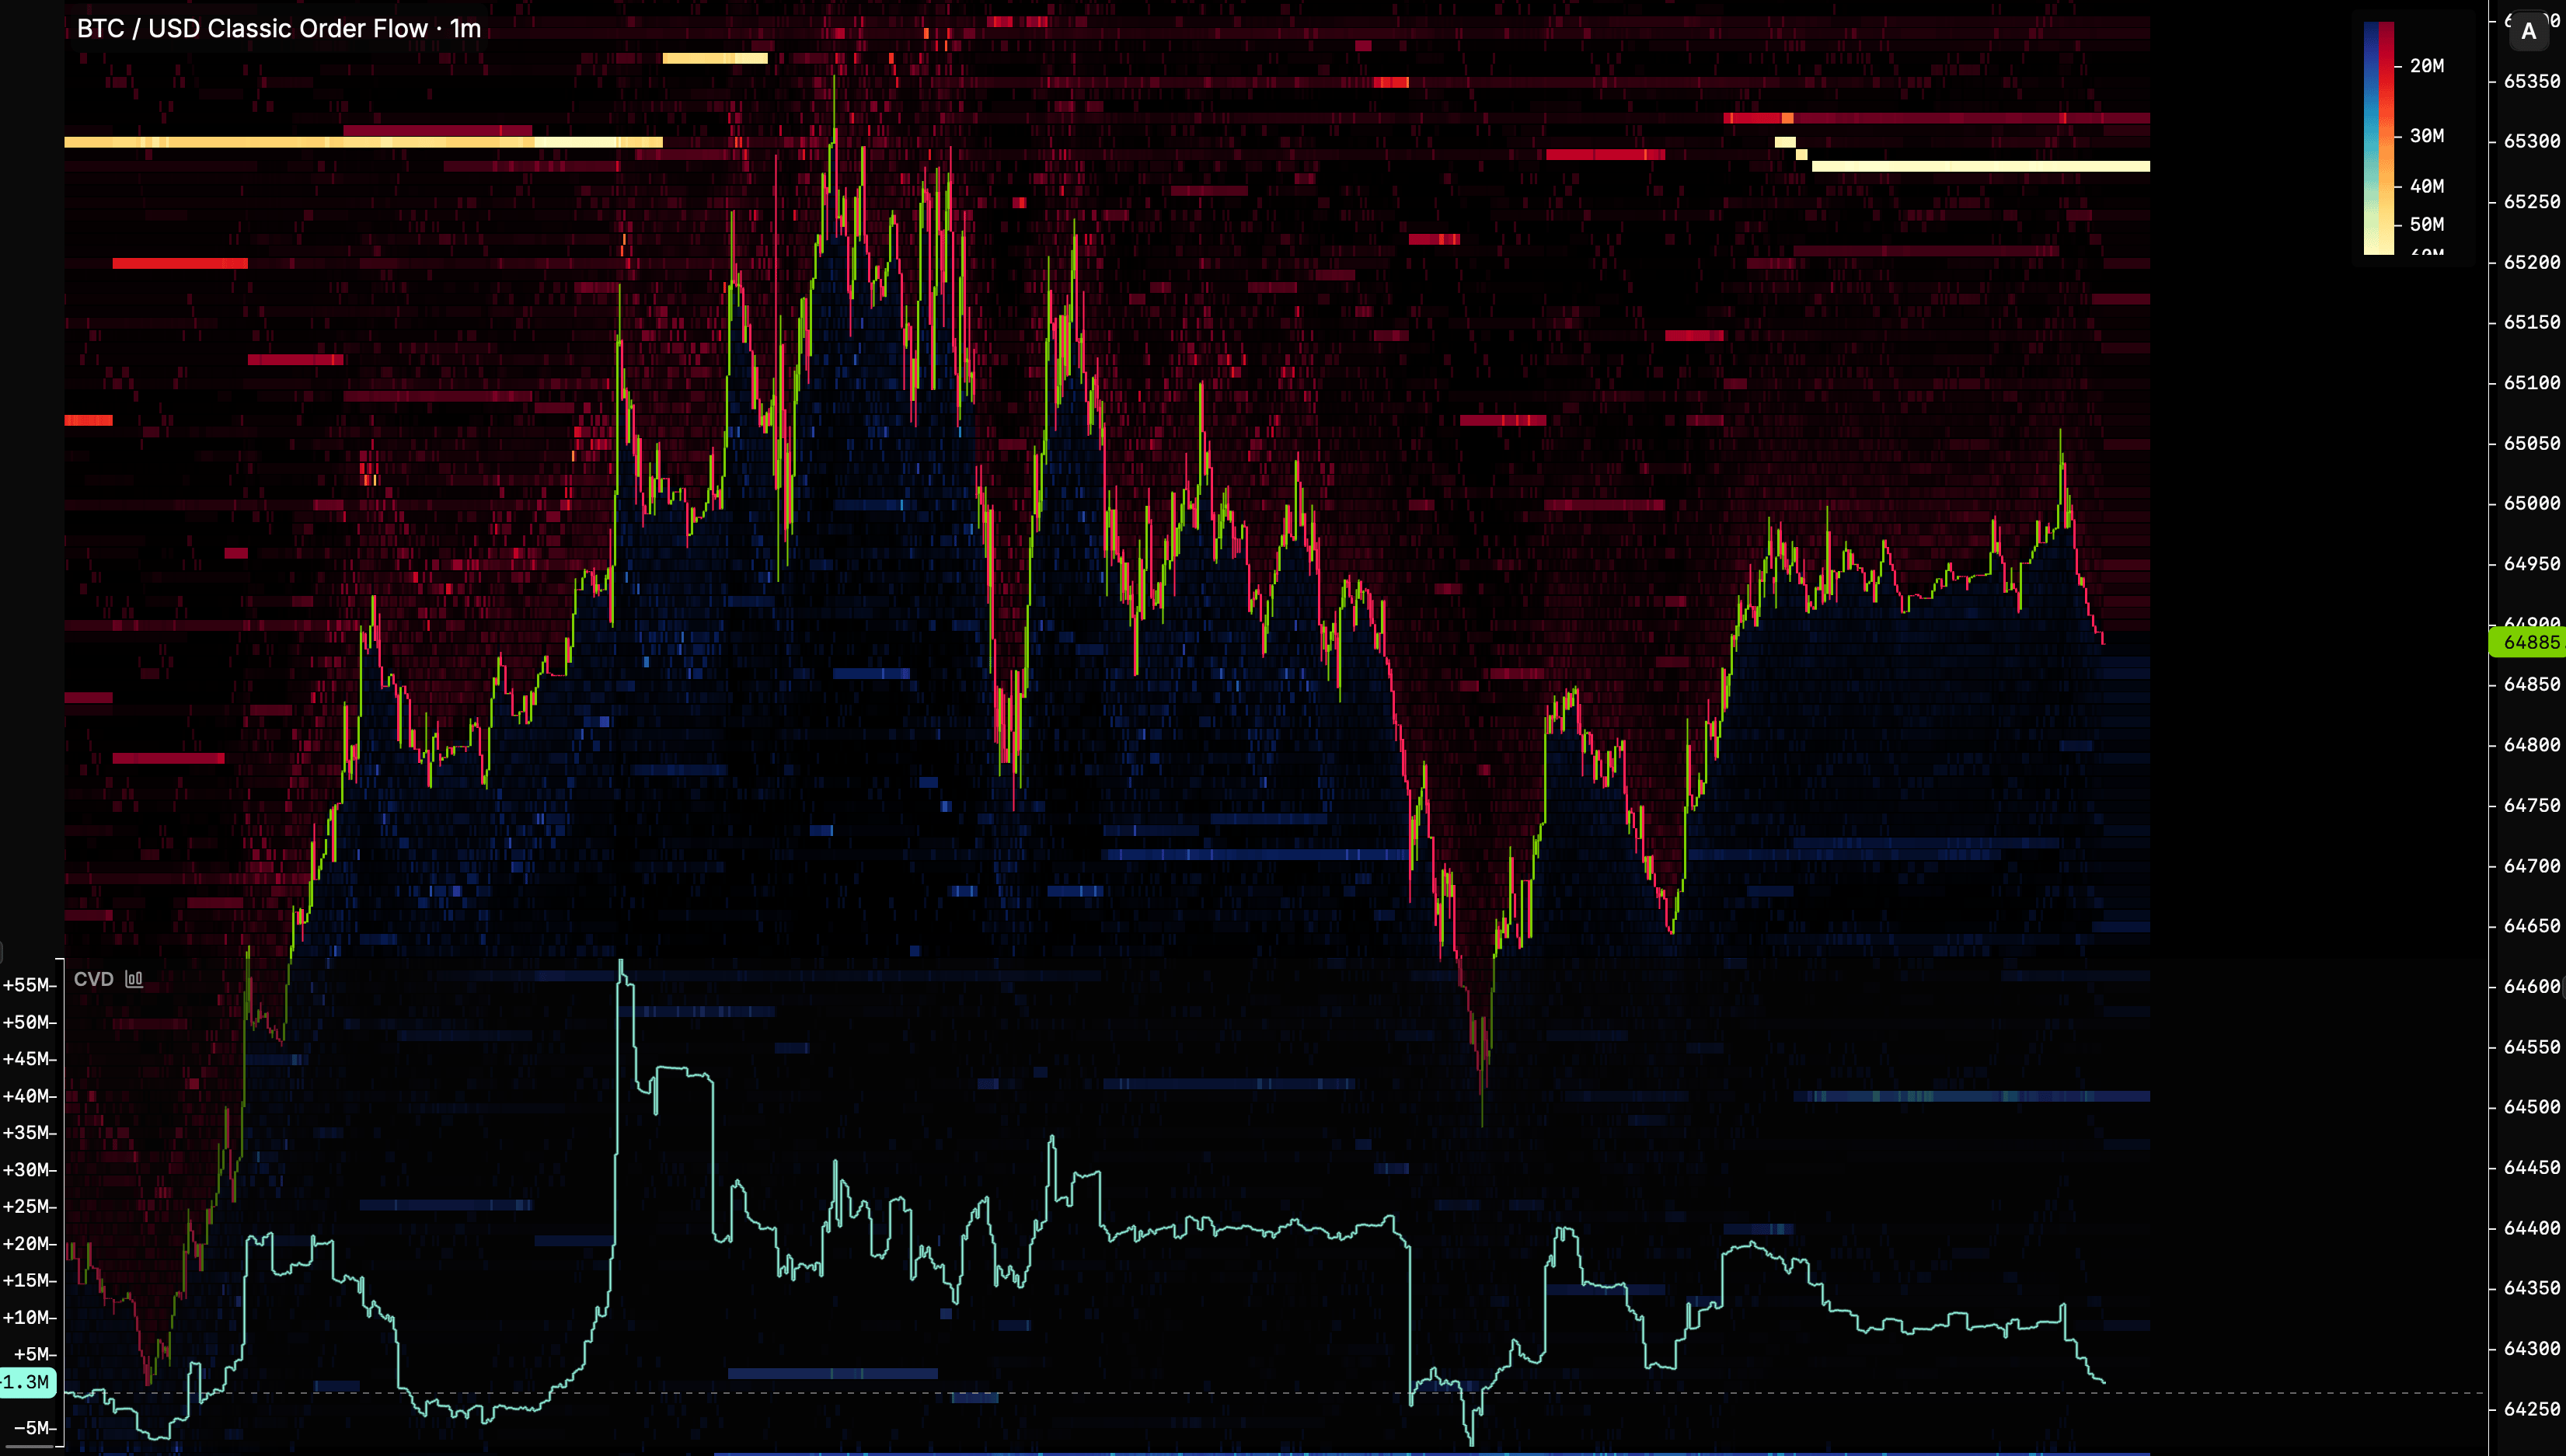
CVD (cumulative volume delta)
CVD is the running sum of volume delta over time: Also derived from raw trades. Volume delta is “this bar’s net buy vs sell”; CVD is the path of that net over the session or chart.Absorption and divergences
Traders often read CVD against price:
- Absorption — price stalls or reverses while CVD keeps pushing one way (net buy or sell volume “eaten” by passive size, or the move fails to progress).
- Bullish divergence — price makes a lower low, CVD a higher low (selling pressure weakens vs price).
- Bearish divergence — price makes a higher high, CVD a lower high (buying pressure weakens vs price).
Open interest
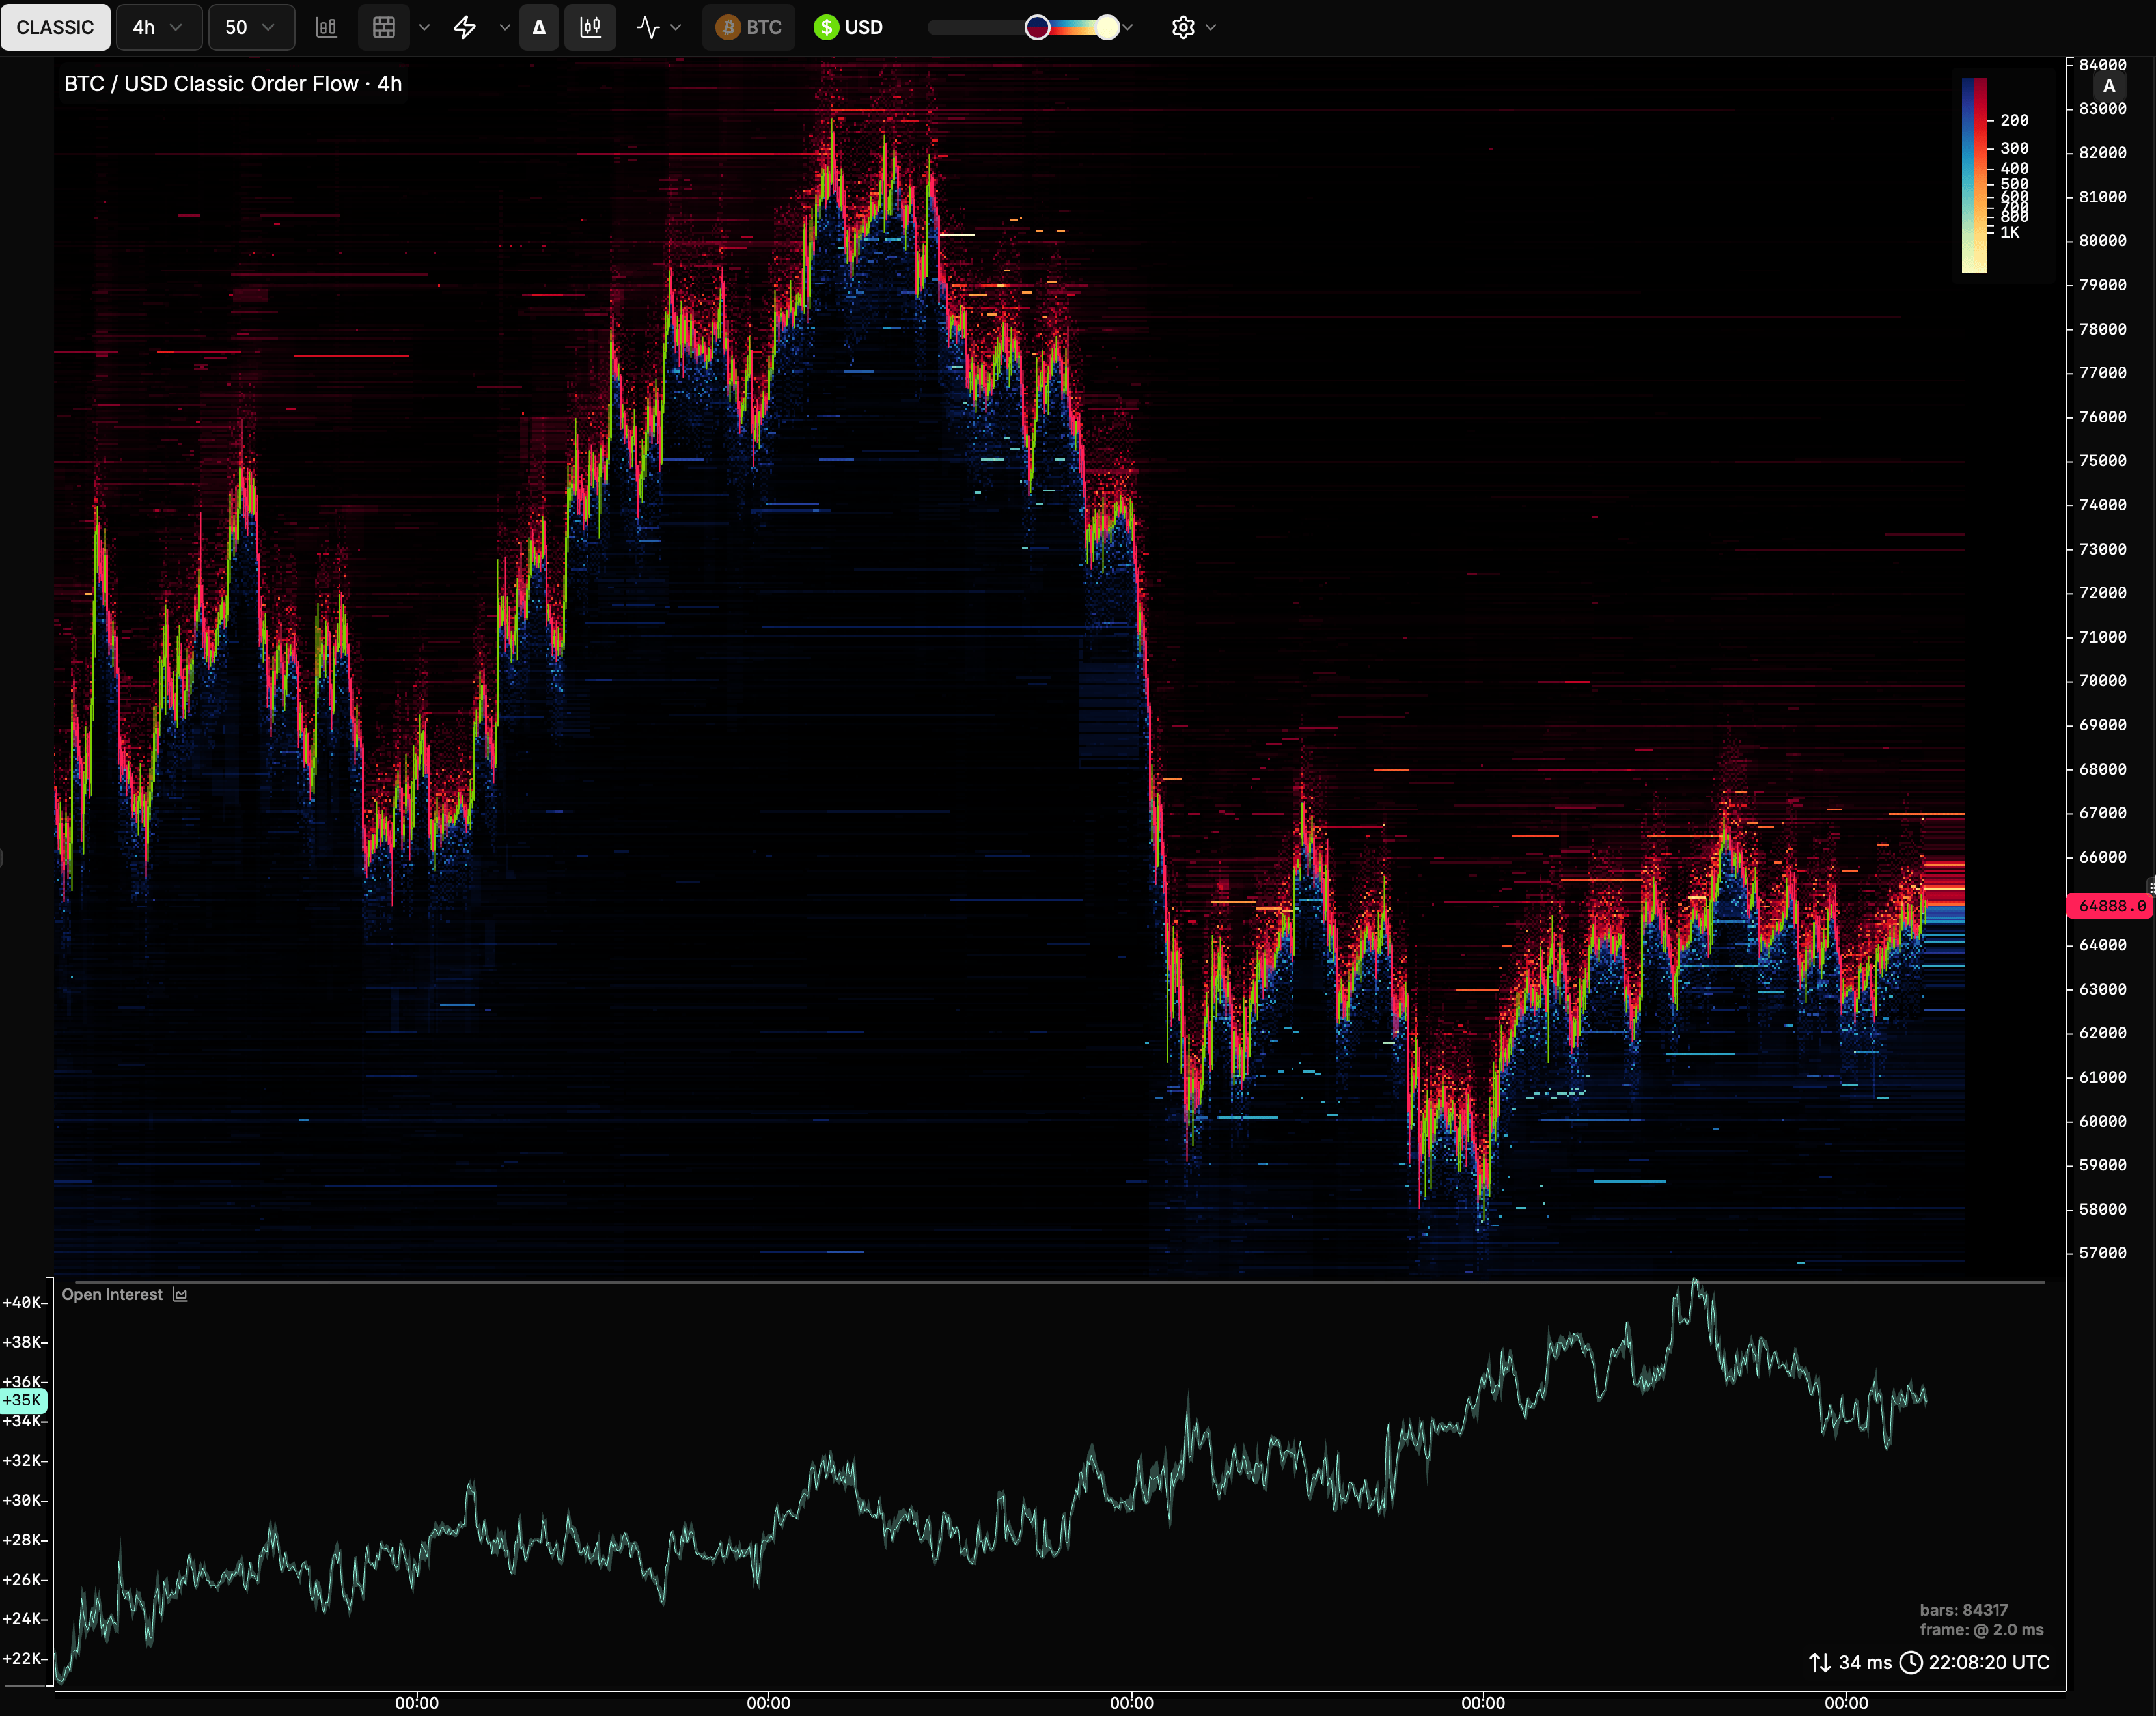
Open interest (OI) is a futures metric: total open positions (outstanding contract interest). Background: Futures markets (including how trades can raise, lower, or leave OI unchanged while volume always rises). MarketLens can show OI in base or quote units (same unit switch as volume and other size series). What each exchange originally publishes varies: base only, quote only, or both. Inverse products often report a contract count, which MarketLens stores as quote (contracts × multiplier). Linear products more often report base.Per-venue (original exchange data)
Converting base ↔ quote
When the venue does not publish both units, MarketLens can still display the other by converting with a current price. That conversion is not exact:- OI is a stock of open contracts built up over many prices and times
- A single spot or mark multiplier is only an approximation of “notional at risk”
- Venue formulas, contract multipliers, and inverse vs linear design also matter
Funding rates
Funding is how perpetual futures stay near the underlying without expiry — periodic payments between longs and shorts. Mechanics: Futures markets (funding, index, mark). On the chart, funding is a time series of the rate (or predicted rate) the venue publishes. How jumpy or smooth it looks depends on how each venue builds the rate from premium — not a single global formula.- Smoother (e.g. Binance) — premium is averaged over the funding interval with more weight on later samples, so short blips fade out.

Binance BTC/USDT perps
- Jumpier (e.g. Hyperliquid) — premium is averaged in a short equal-weight window. A sharp premium move can step the rate, and drop out again when that sample leaves the window — so the line jumps even when price is quiet.

Hyperliquid BTC/USDC perps
Liquidations
A liquidation is a forced order: the venue closes a leveraged position when margin is insufficient. That close still prints as buy or sell aggression against the book — not optional trading.
So large long-liquidation clusters often read as bad for price (forced supply); short-liquidation clusters as supportive for a squeeze up. Cascades matter more than single prints: a drop into long liqs can add more sells, which can push price further and trigger more longs.
This is executed liquidation flow (what the exchange reports as forced closes). It is not the same as open liquidation levels on Hyperliquid (pending risk if price reaches a level) — see Liquidations, TP & SL.
What MarketLens shows
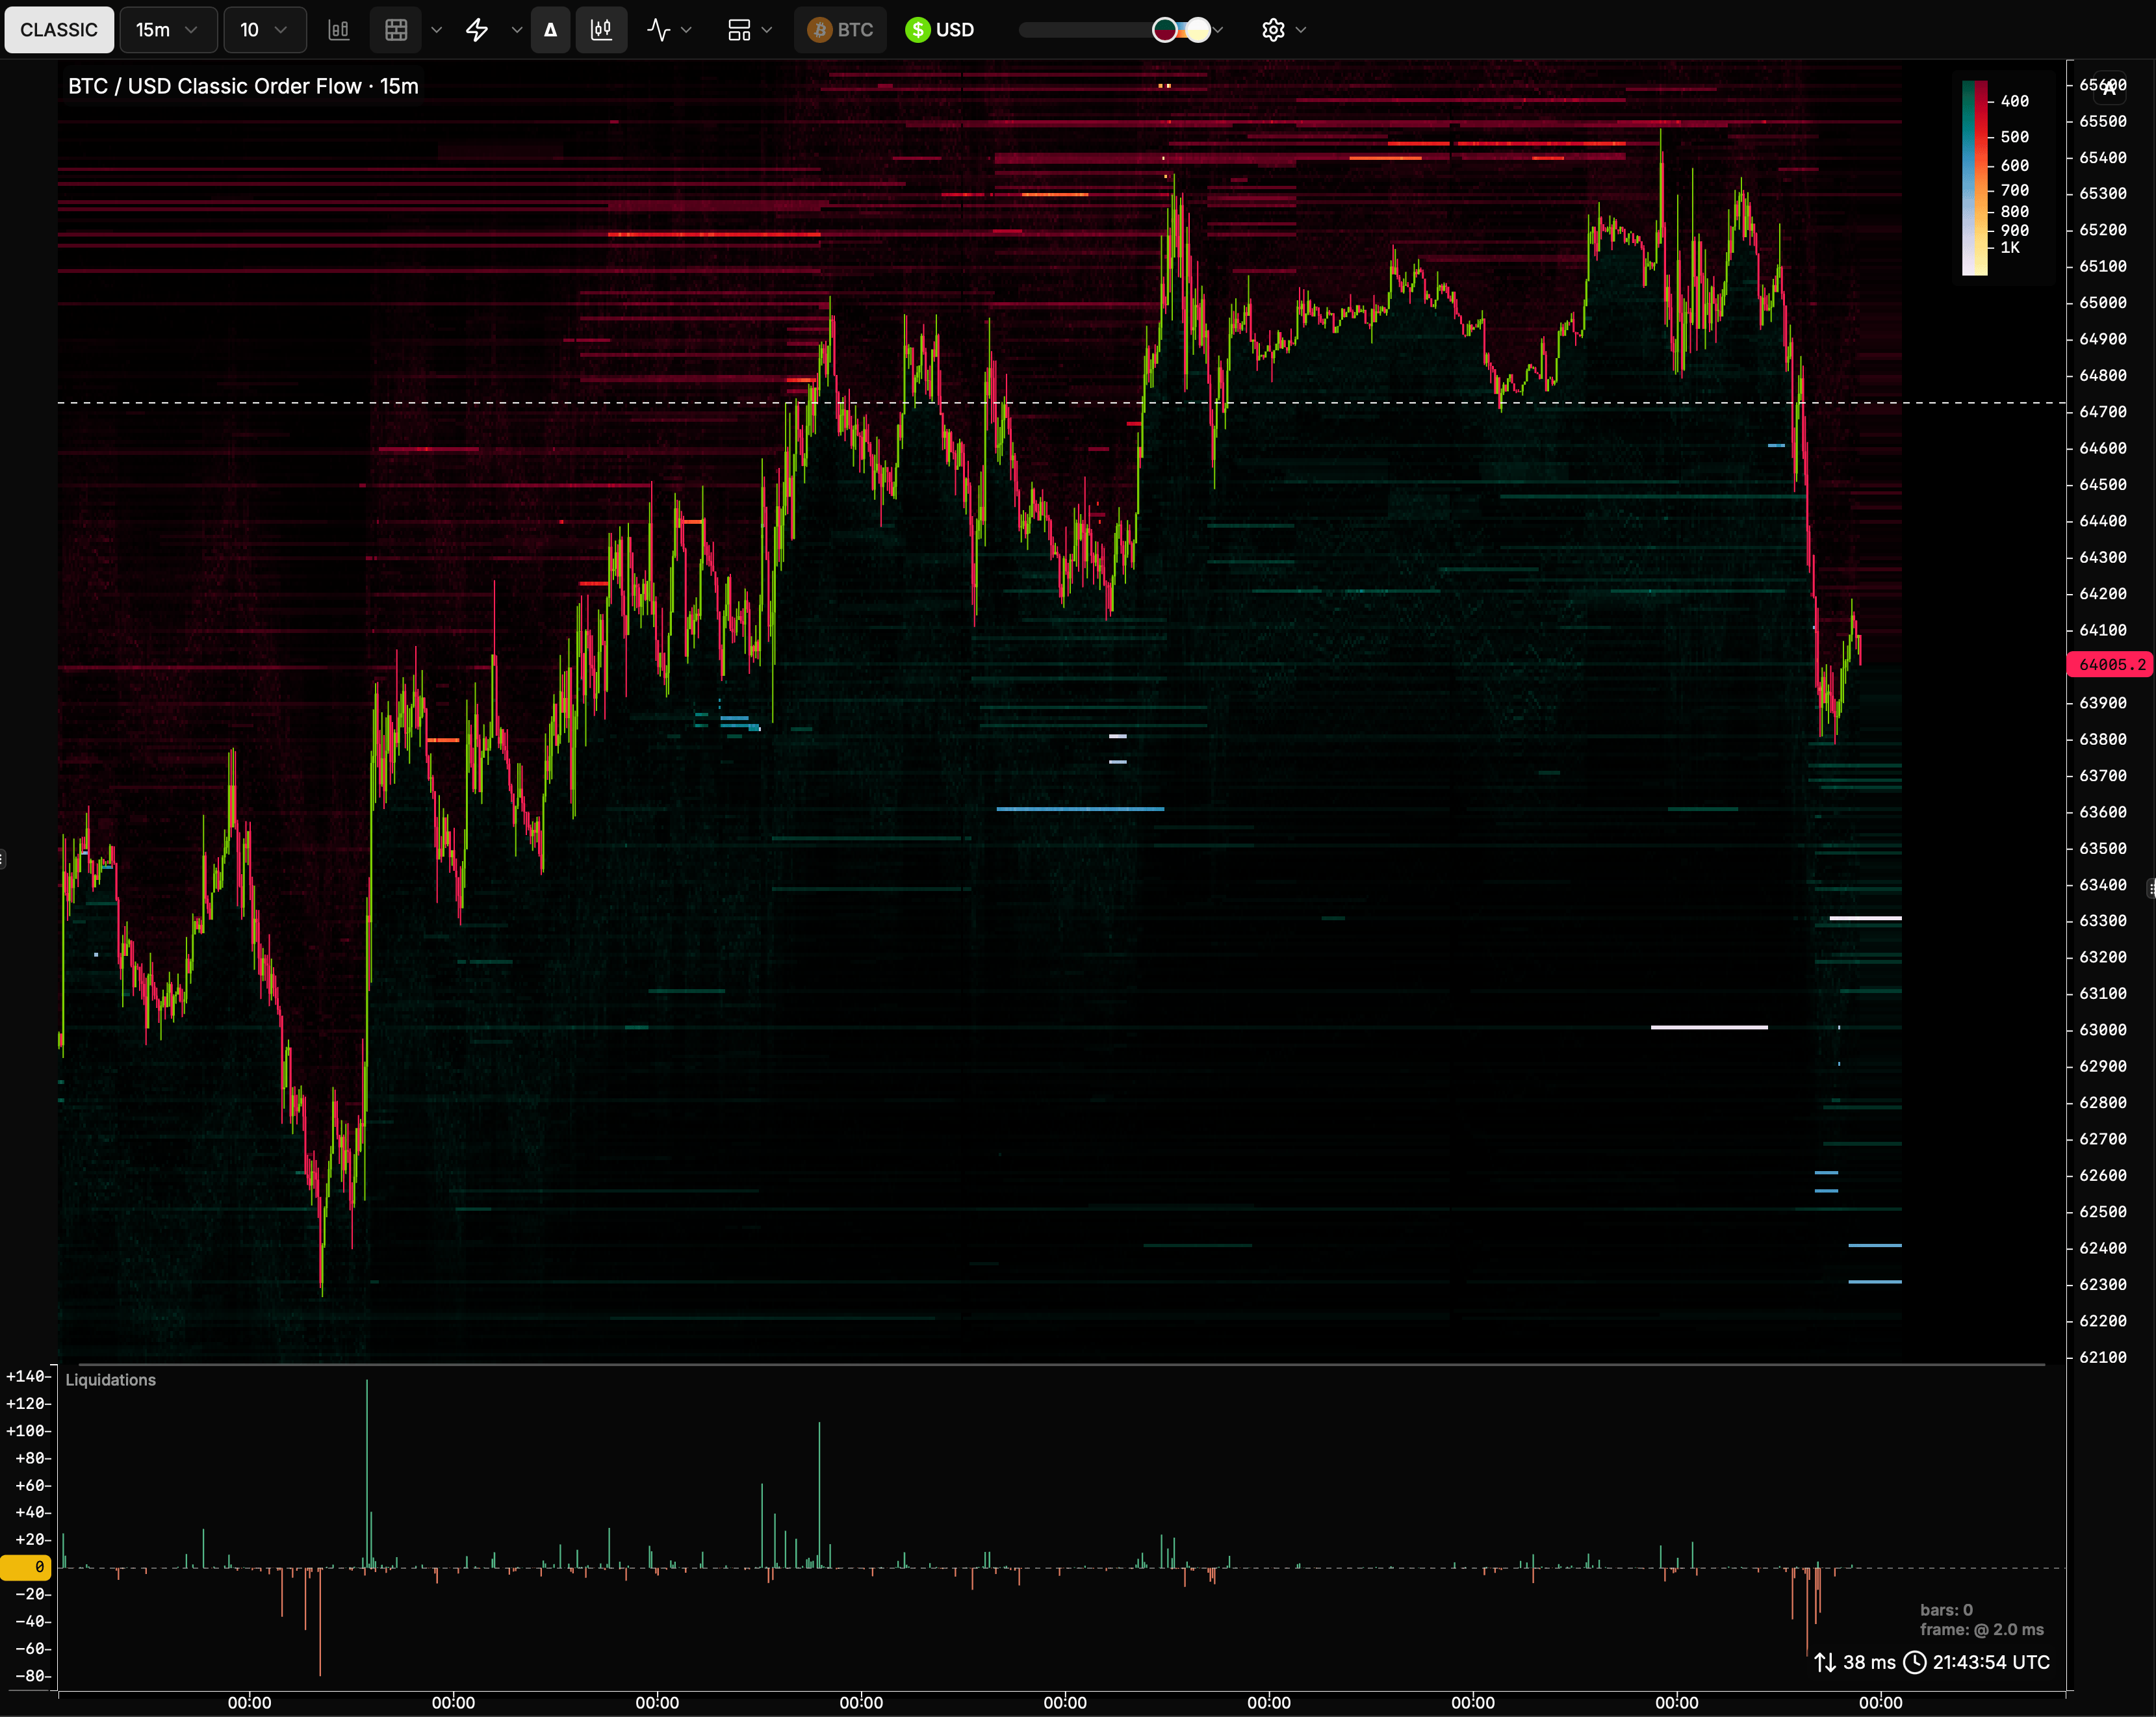
Bar metrics use the same shape as trade volume:
Coloring matches volume: force sells are sells → red; force buys → green. That tracks how forced selling usually hurts price and forced covering usually helps it.
Units follow the same base / quote switch as volume. Multi-market views sum liquidation size (like volume), not like OI.
Coverage: who publishes “all” liquidations?
Venues differ in how complete public liquidation data is.
MarketLens charts what the venue publishes. On Bybit / Hyperliquid / Lighter, that is the full forced-flow story. On Binance / OKX, it is a sampled feed — useful for activity and direction, not for counting every forced close.
Price and original size by venue
When only one unit is published, MarketLens can still show the other via × / ÷ price. For Binance / Bybit / OKX that price is often a bankruptcy / liquidation reference, not last trade — so the converted unit is approximate. Prefer the unit the venue actually reported when exact size matters.