TradingLite tape + histogram
Single market
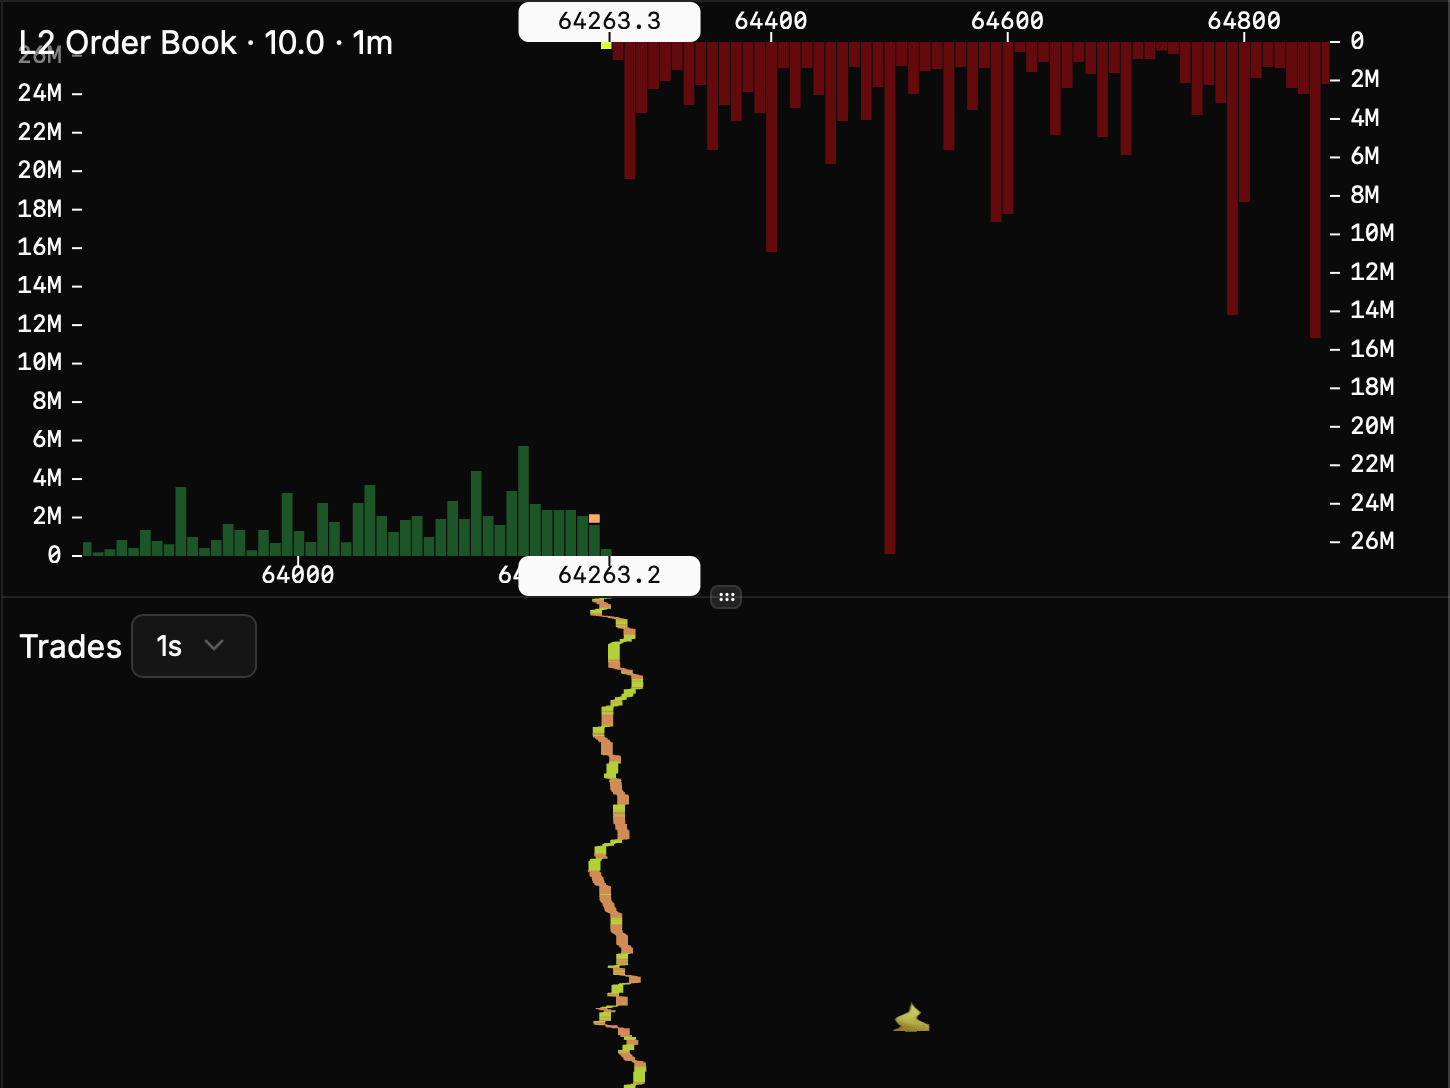
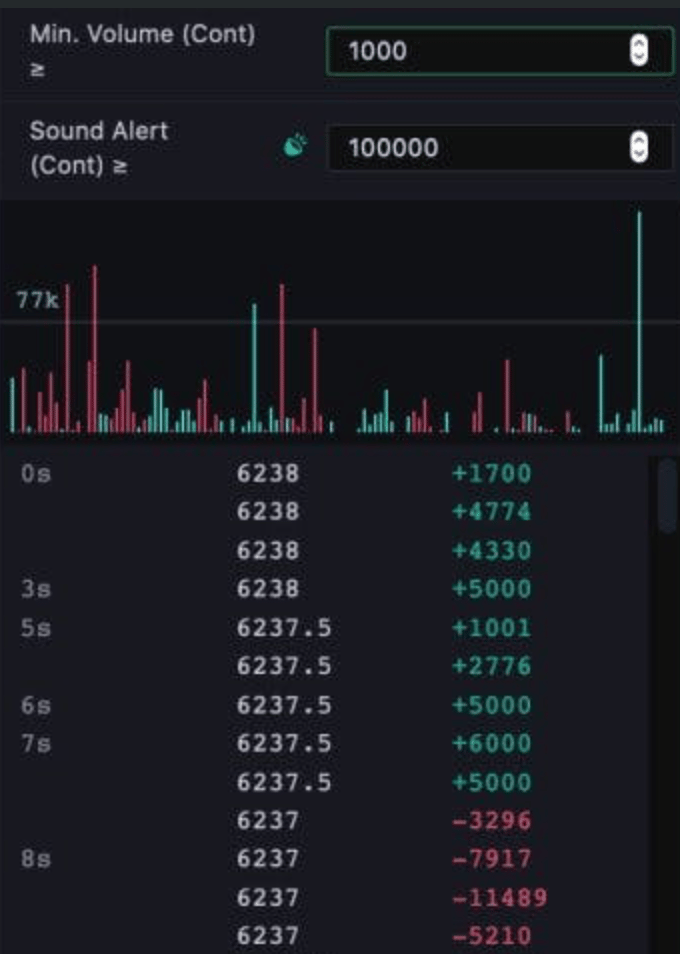
Following the principle that values should be visually measurable, each trade is a stripe (bar) whose length is proportional to size. The order book next to the tape provides a natural size reference: the same N pixels on the tape and on the book mean the same size S (shared size scale).- X (price) is shared with the book; each stripe sits at its trade price
- Green stripes are buys, red are sells (depends on the selected color scheme)
- Large trades are drawn as stripes separated by a tiny gap, so big prints stay readable as stacked segments instead of one solid block
- Time on the right is non-linear and shows how much size traded and how quickly activity clusters
Multiple markets
Aggregation is straightforward: trades from all selected markets are drawn on the same view. Time is not continuous print-by-print across venues. Prints are synchronized into time slices (groups) — 1 second on screen — so multi-market activity stays readable. Hover a market in the markets list to highlight only that venue’s trades on the tape.Liquidations
Liquidations are forced trades on futures markets when a position is closed because the account can no longer meet margin (bankruptcy / liquidation process on that venue). MarketLens marks them with a fire icon. If size is large enough, a stripe is drawn for the liquidation as well. Venues report liquidation prices differently: