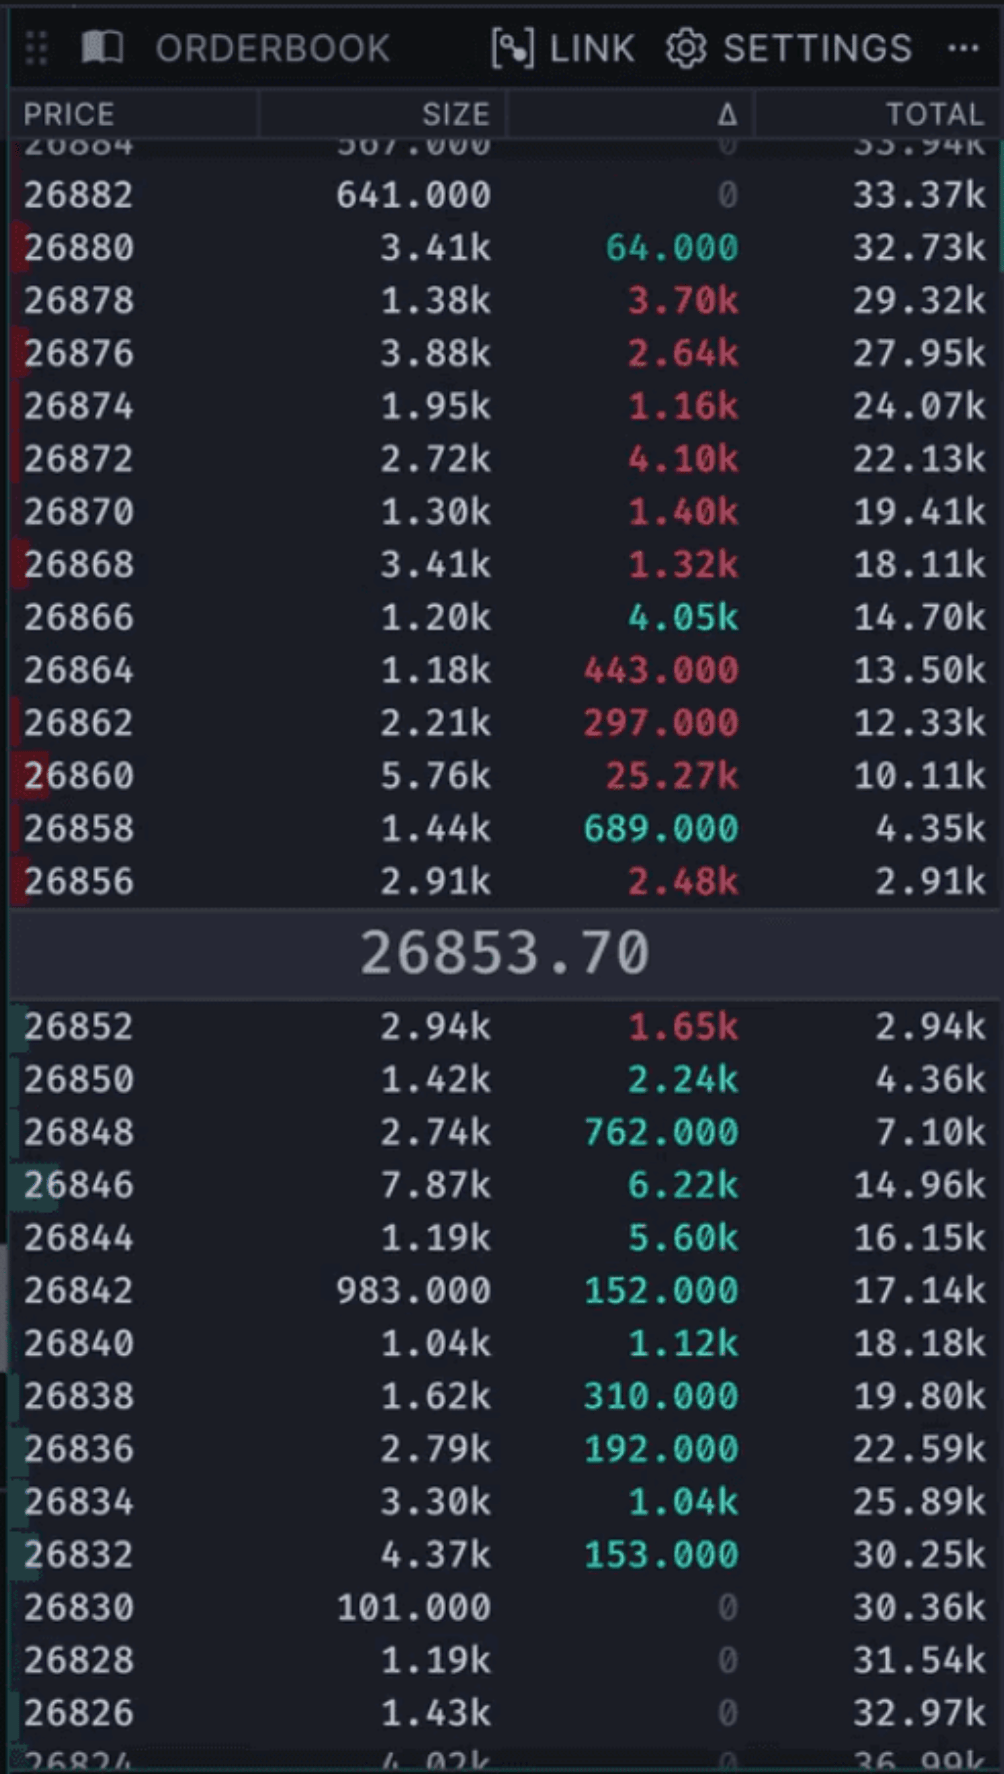
Plain order books are as old as limit orders: a list of resting bids and asks. As electronic trading matured, order book visualizations became common — usually tables or DOMs built around a single venue. A typical tabular order book is centered on the mid price ((best bid + best ask) / 2), with extra columns such as recent size changes.
TradingLite-style tabular order book centered on mid price

TradingLite order book (tabular)
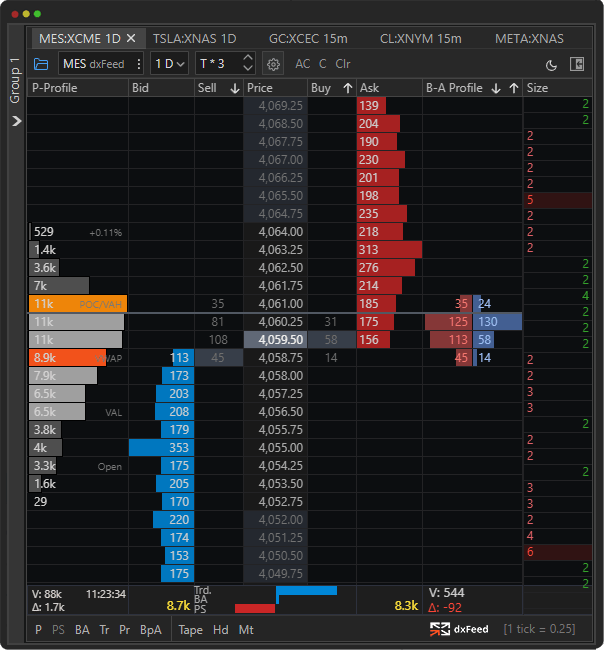
Another popular form is the DOM (depth of market). It often keeps a stable price axis instead of re-centering every update, so bids and asks move on a fixed ladder — which makes the ongoing auction easier to feel.
Exocharts-style DOM with stable price axis

Exocharts DOM

Those presentations still tend to:
  • stay tabular
  • rely heavily on reading numbers
  • work poorly for multi-market aggregation (there is no single mid price anymore)
MarketLens’s L2 view is designed to address that.

Single-market order book

An L2 book is still a list of price and size pairs for bids and asks. Drawn vertically, that becomes two horizontal bar charts facing each other so you can tell sides apart and see the bid/ask fight at a glance. Top and bottom size scales match (one shared size scale, read from opposite edges). Left and right price scales match (one price range).
  • Bids grow from the left (left Y + bottom size axis)
  • Asks grow from the right (right Y + top size axis)
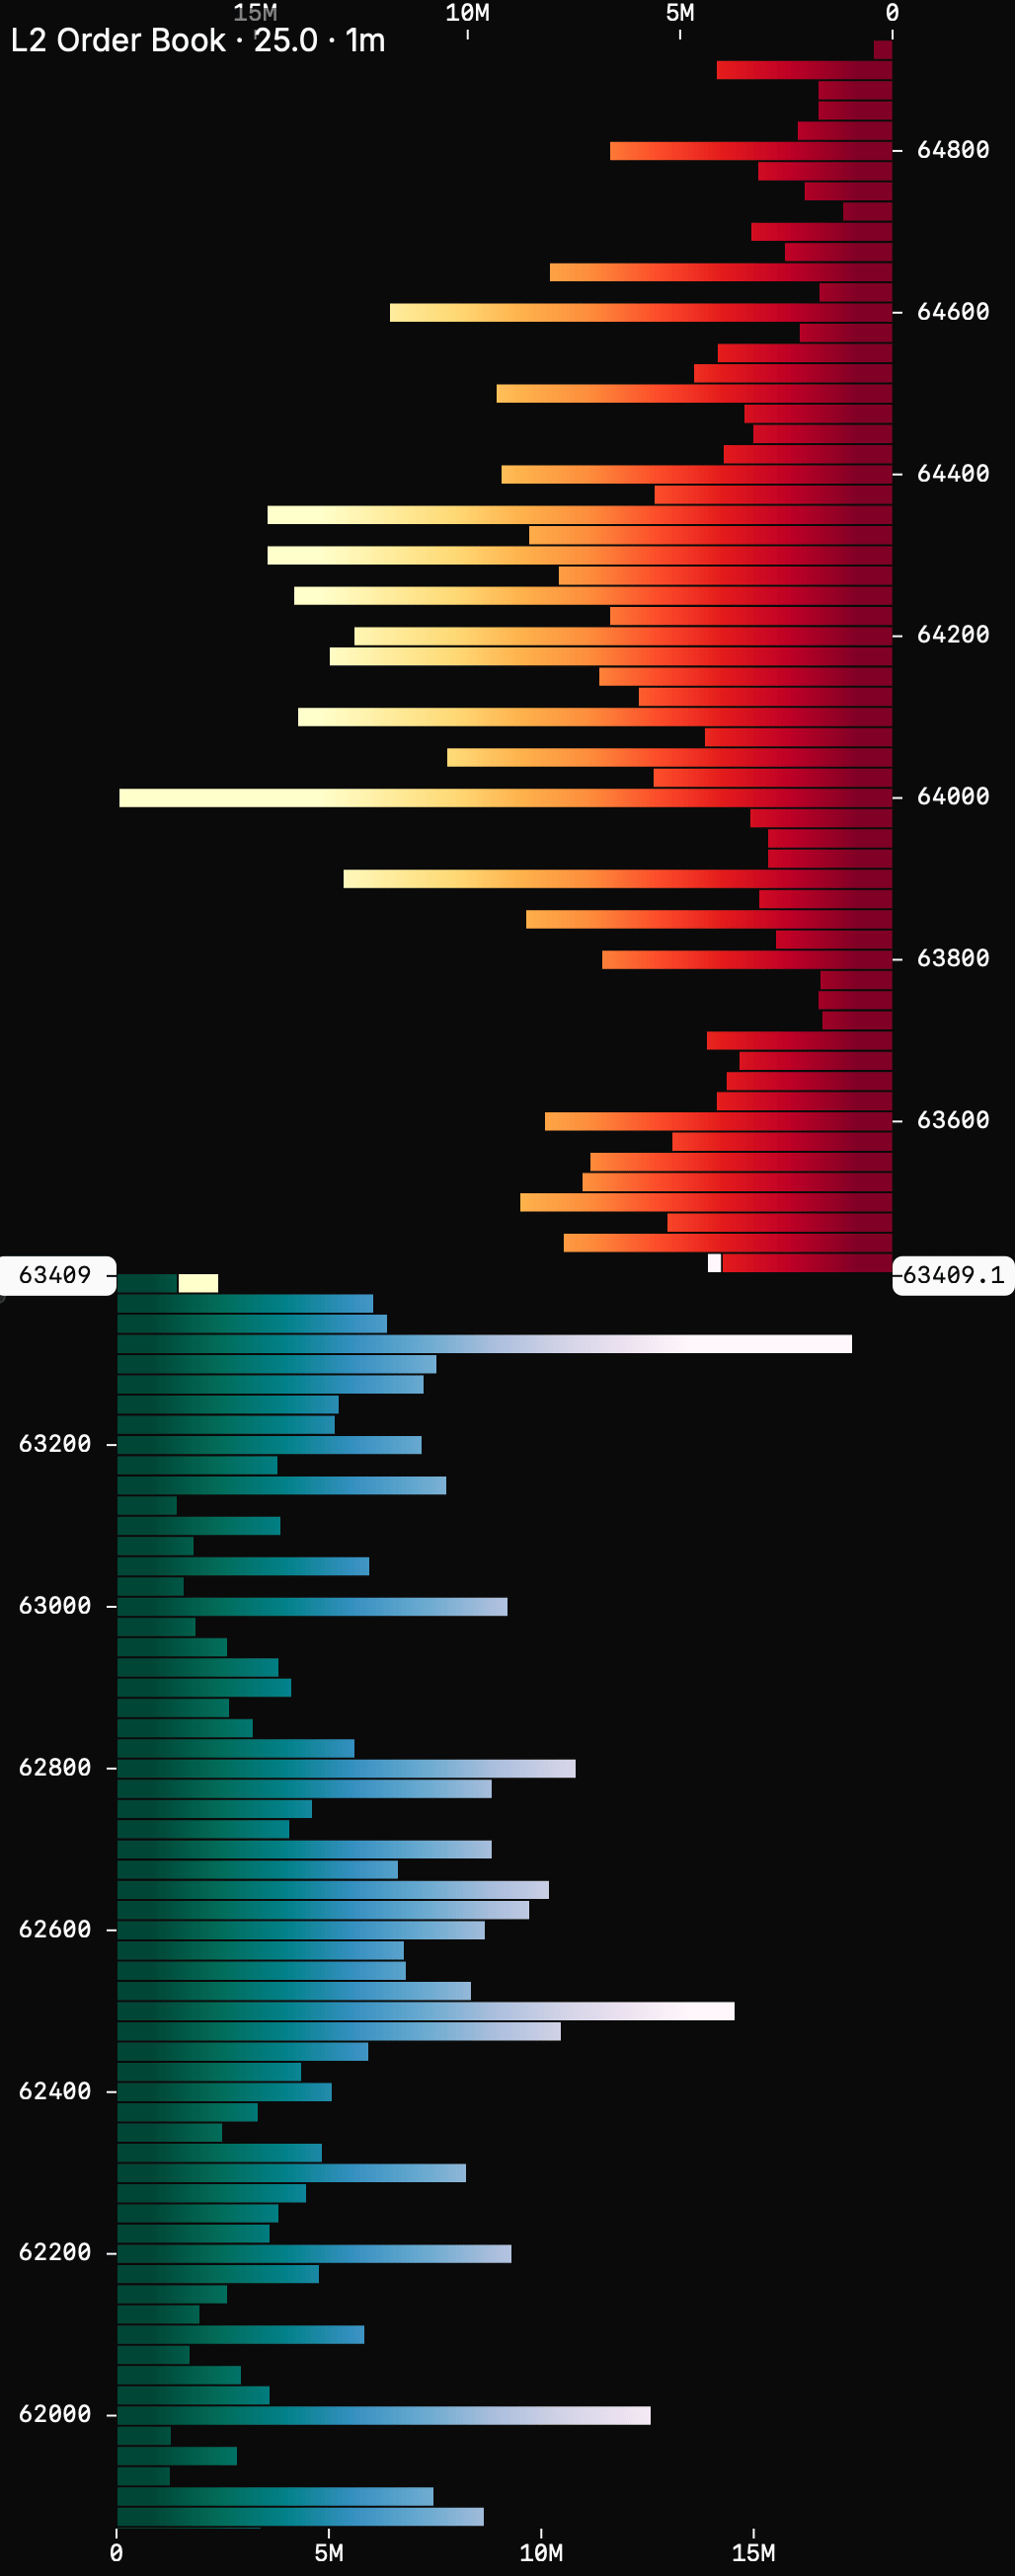
Bar length is proportional to size on that shared scale. MarketLens visual L2 order book: bids as bars from the left, asks from the right, shared price and size scales

Automatic grouping

The book is interactive — zoomable and pannable. Price grouping adapts to the selected zoom level so you can move from fine ticks to coarser buckets without leaving the view.

Multi-market

On a traditional table or DOM, aggregating several markets is awkward: there is no single mid price to center on, and columns do not merge cleanly. A visual book with bids and asks on opposite sides makes multi-market aggregation natural: sizes at the same (grouped) price add into the same bars. Hover a market in the markets panel to highlight only that venue’s contribution.

Recent executed orders

DOMs add extra columns for trades executed in a recent window (for example the last minute) — rolling buy/sell activity at price. The visual order book can show that activity in the same space as resting depth. See also: L4 order book, Tape, Classic order flow.