
Liquidations
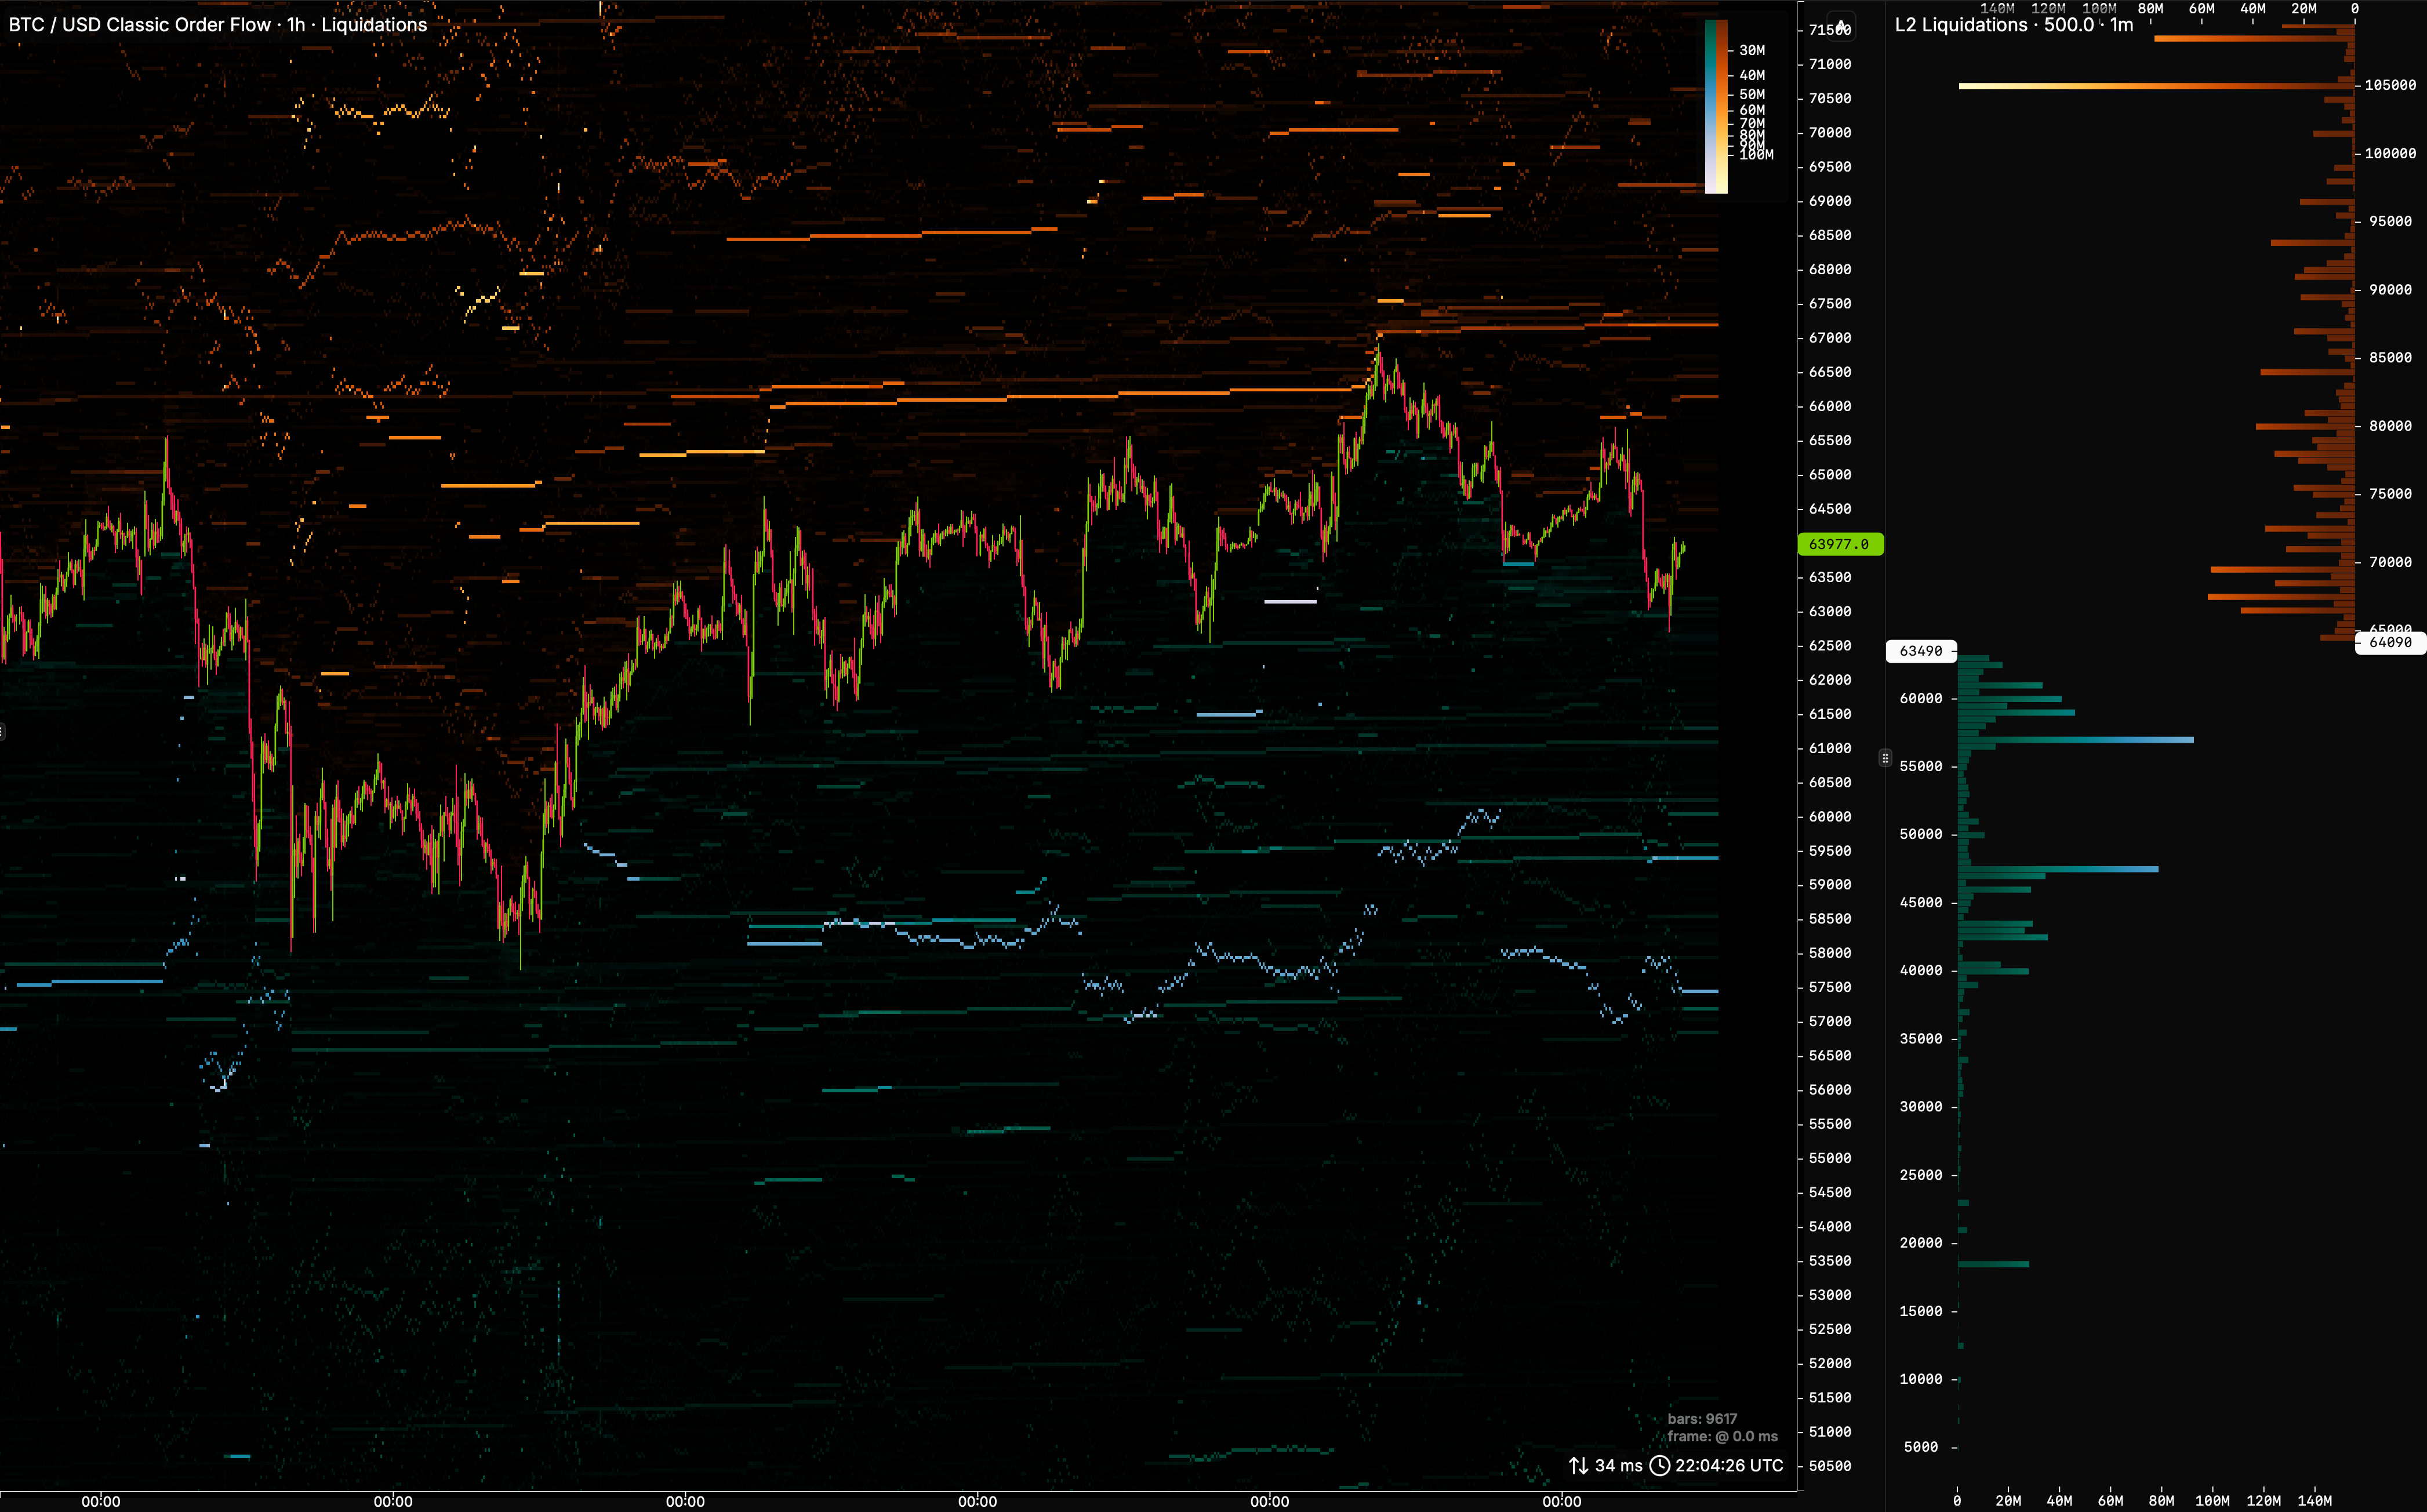
Many tools try to estimate liquidation levels: how much size would be forced out if price hits a level. With Hyperliquid you can see liquidations as they actually are, from venue data. A liquidation is a forced order:
That forced flow is often read as fuel for continuation: a move into a dense liquidation zone can accelerate as bankrupt positions are closed the wrong way relative to the move.
Levels vs fills: this page is about open Hyperliquid liquidation liquidity (where risk sits if price gets there). Executed liquidations across venues (forced buy/sell prints, bar metrics, scripting) are documented under Metrics → Liquidations.
Take profits and stop losses
Many venues support trigger orders: when price reaches a level, the venue places a child order. That child may be a market order (immediate aggression) or a limit order (rests as a bid or ask). Hyperliquid is the first venue that exposes where those resting take-profit and stop-loss interests sit, so they can be drawn like liquidity — not guessed.Direction by type and side of the market
What that interest becomes when the trigger fires depends on the child order:
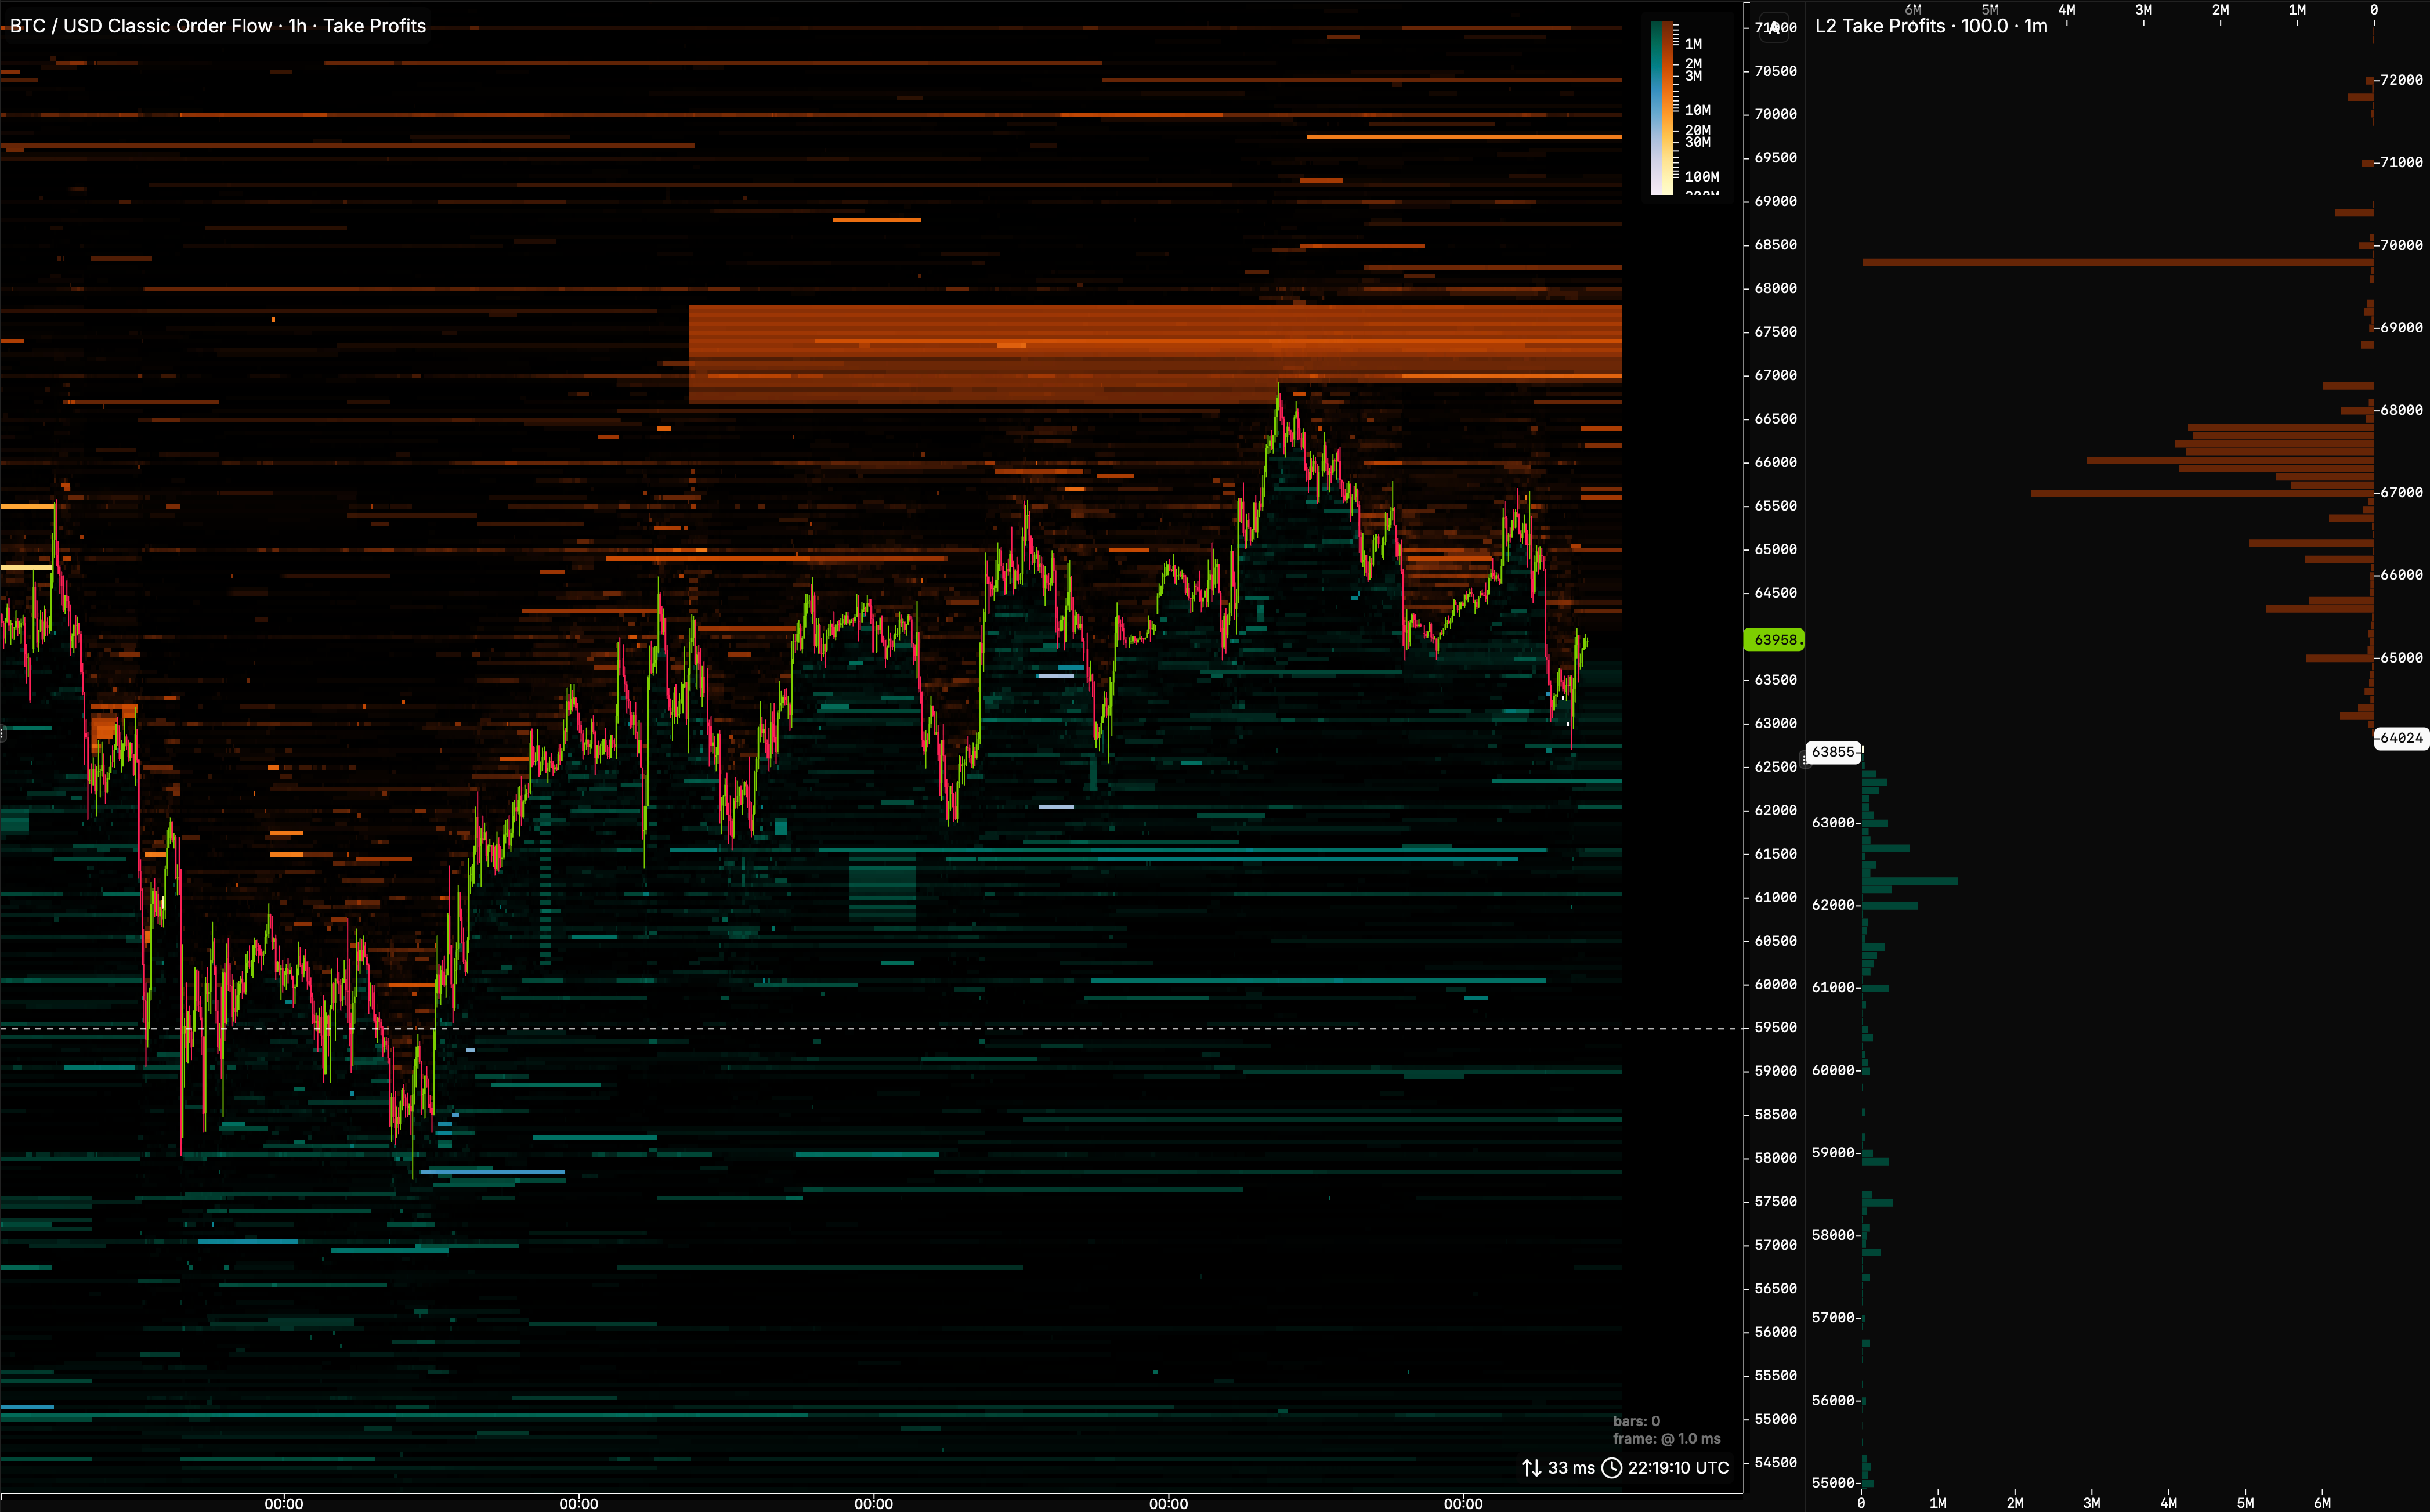
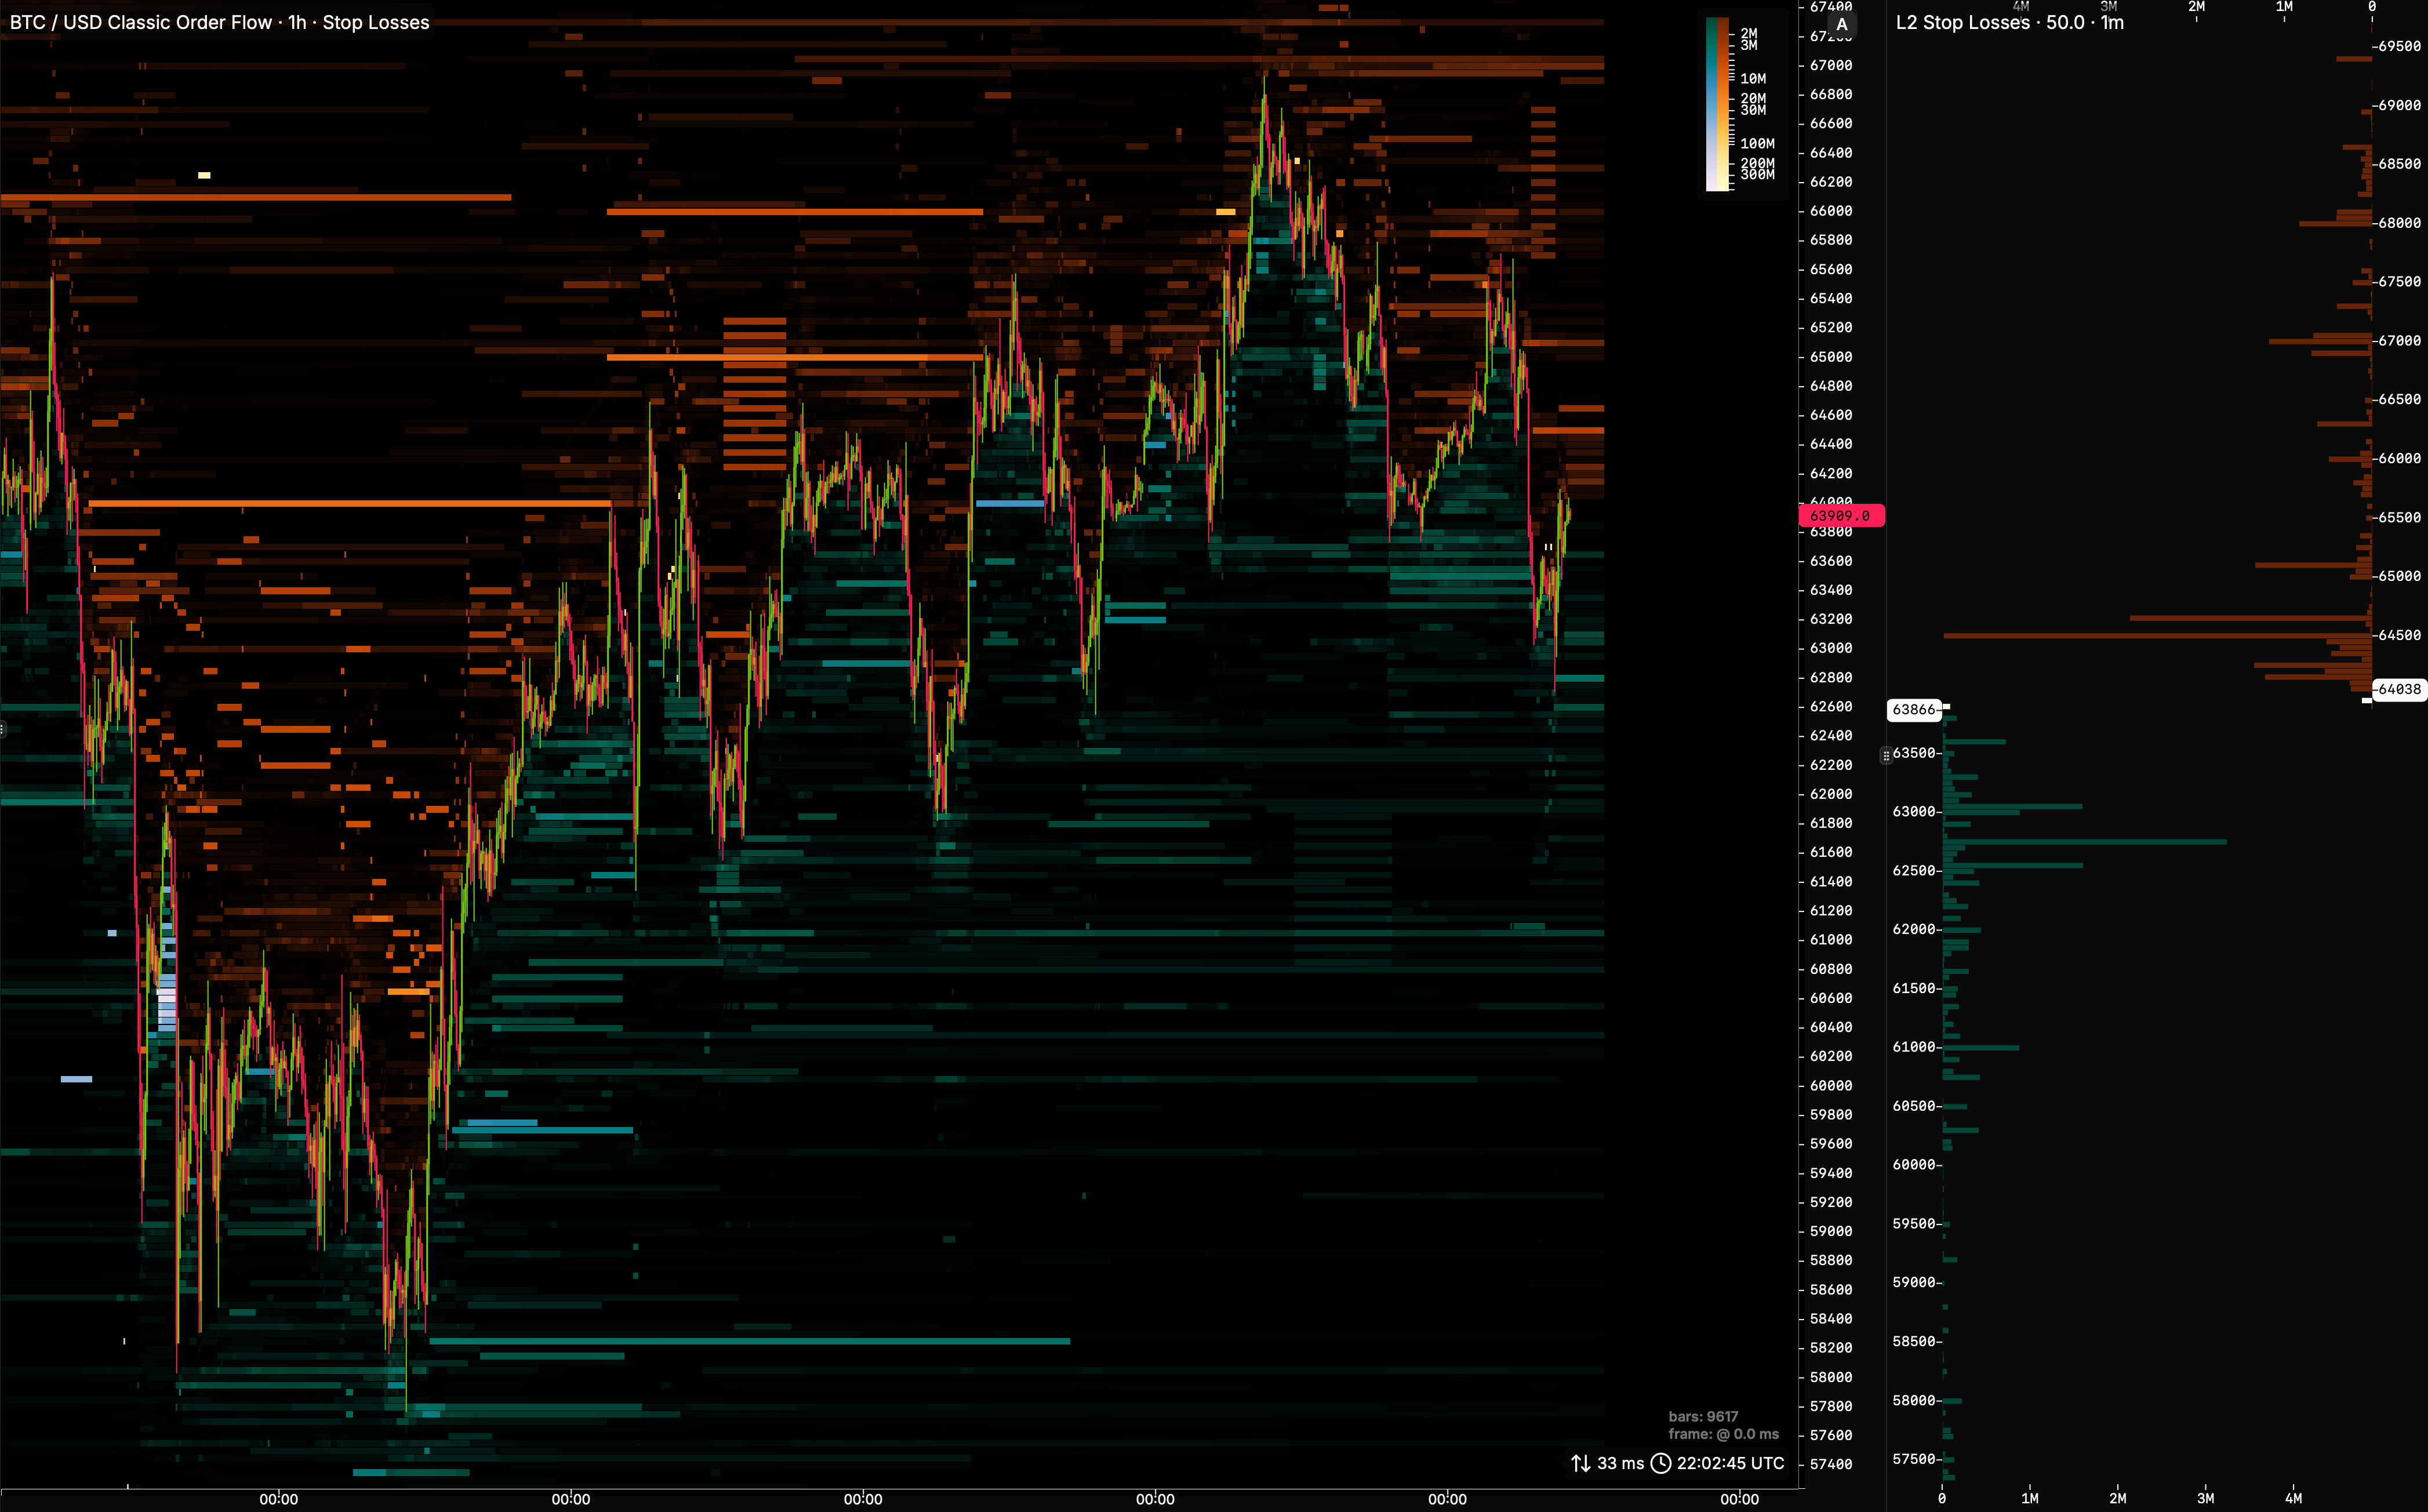
So a take profit above the market is always sell-side intent, but it may print as a market sell or sit as an ask. A take profit below is always buy-side intent (market buy or bid). Stops flip the same way: stops above are buy-side (market buy or bid); stops below are sell-side (market sell or ask).
How to read them (roughly):
- Take profits often act like resistance / support — interest that may lean against the move when price arrives (especially if the child is a limit that rests)
- Stop losses often act like fuel for continuation — triggered flow in the direction of the break (especially market children)
Take profits
Stop losses
Four kinds of liquidity (summary)
See also: L4 order book, Trades (Tape), Trading, Hyperliquid product page.